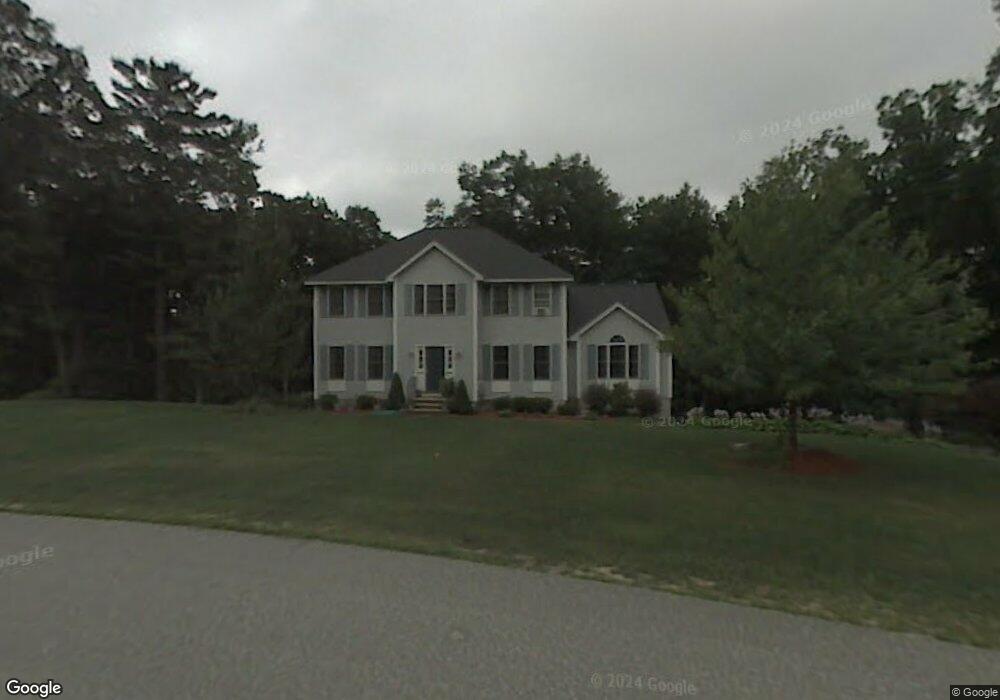
79 Wyndridge Cir Pelham, NH 03076
Estimated Value: $757,660 - $816,000
4
Beds
3
Baths
2,588
Sq Ft
$305/Sq Ft
Est. Value
About This Home
This home is located at 79 Wyndridge Cir, Pelham, NH 03076 and is currently estimated at $788,915, approximately $304 per square foot. 79 Wyndridge Cir is a home with nearby schools including Pelham Elementary School, Pelham Memorial School, and Pelham High School.
Ownership History
Date
Name
Owned For
Owner Type
Purchase Details
Closed on
Dec 23, 1998
Sold by
Elio Inc
Bought by
Harper Thomas P and Harper Marylyn D
Current Estimated Value
Home Financials for this Owner
Home Financials are based on the most recent Mortgage that was taken out on this home.
Original Mortgage
$224,910
Outstanding Balance
$51,573
Interest Rate
6.89%
Estimated Equity
$737,342
Create a Home Valuation Report for This Property
The Home Valuation Report is an in-depth analysis detailing your home's value as well as a comparison with similar homes in the area
Home Values in the Area
Average Home Value in this Area
Purchase History
| Date | Buyer | Sale Price | Title Company |
|---|---|---|---|
| Harper Thomas P | $249,900 | -- |
Source: Public Records
Mortgage History
| Date | Status | Borrower | Loan Amount |
|---|---|---|---|
| Open | Harper Thomas P | $224,910 |
Source: Public Records
Tax History Compared to Growth
Tax History
| Year | Tax Paid | Tax Assessment Tax Assessment Total Assessment is a certain percentage of the fair market value that is determined by local assessors to be the total taxable value of land and additions on the property. | Land | Improvement |
|---|---|---|---|---|
| 2024 | $11,022 | $601,000 | $168,100 | $432,900 |
| 2023 | $10,932 | $601,000 | $168,100 | $432,900 |
| 2022 | $10,469 | $601,000 | $168,100 | $432,900 |
| 2021 | $9,592 | $601,000 | $168,100 | $432,900 |
| 2020 | $9,187 | $454,800 | $134,500 | $320,300 |
| 2019 | $8,823 | $454,800 | $134,500 | $320,300 |
| 2018 | $8,704 | $405,600 | $134,500 | $271,100 |
| 2017 | $8,700 | $405,600 | $134,500 | $271,100 |
| 2016 | $8,497 | $405,600 | $134,500 | $271,100 |
| 2015 | $8,362 | $359,500 | $128,300 | $231,200 |
| 2014 | $8,222 | $359,500 | $128,300 | $231,200 |
| 2013 | $8,316 | $363,600 | $128,300 | $235,300 |
Source: Public Records
Map
Nearby Homes
- 25 Misty Ln
- 290 Mammoth Rd
- 73 A&B Mammoth Rd
- 73 Mammoth Rd Unit A&B
- 73 Mammoth Rd
- 9 Cornstalk Ln
- 23 Chardonnay Rd
- 446 Mammoth Rd
- 436 Mammoth Rd
- 19 Mcgrath Rd
- 67 2nd St
- 53 4th St
- 10 Oakland Ridge Rd Unit 11
- 508 Mammoth Rd
- 5 Stephanie Dr
- 79 B St
- 97 Passaconaway Dr
- 50 Sagewood Dr
- 31 Sagewood Dr Unit 31
- 16 Dragonfly Dr
- 77 Wyndridge Cir
- 75 Wyndridge Cir
- 82 Wyndridge Cir
- 185 Wyndridge Cir
- 91 Wyndridge Cir
- 15 Lynnwood Ln
- 191 Wyndridge Cir
- 70 Wyndridge Cir
- 170 Westfall Rd
- 197 Wyndridge Cir
- 9 Greenmeadow Dr
- 168 Westfall Rd
- 62 Wyndridge Cir
- 20 Lynnwood Ln
- 105 Wyndridge Cir
- 171 Wyndridge Cir
- 190 Wyndridge Cir
- 184 Westfall Rd
- 152 Westfall Rd
- 104 Wyndridge Cir