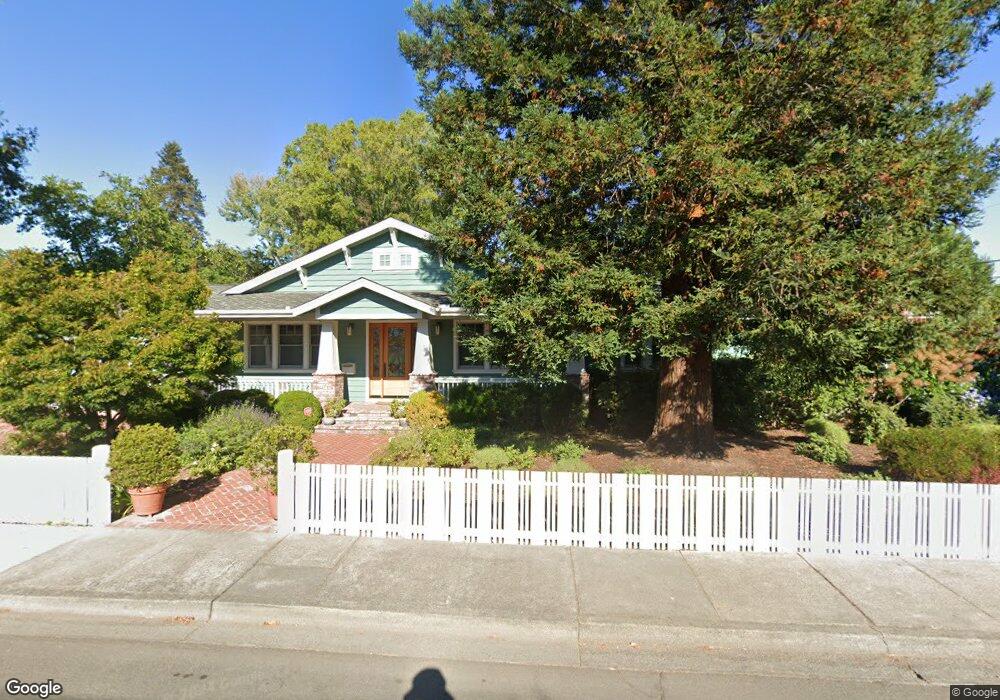
790 2nd St E Sonoma, CA 95476
Estimated Value: $1,878,000 - $3,023,000
2
Beds
1
Bath
1,336
Sq Ft
$2,003/Sq Ft
Est. Value
About This Home
This home is located at 790 2nd St E, Sonoma, CA 95476 and is currently estimated at $2,675,360, approximately $2,002 per square foot. 790 2nd St E is a home located in Sonoma County with nearby schools including Prestwood Elementary School, Adele Harrison Middle School, and Creekside High School.
Ownership History
Date
Name
Owned For
Owner Type
Purchase Details
Closed on
Jun 17, 2020
Sold by
Burcham William James and Burcham Sandra Sussan
Bought by
Burcham William James and Burcham Sandra Susan
Current Estimated Value
Purchase Details
Closed on
Sep 3, 2015
Sold by
Muller Bruce and Christensen Bethany Sue
Bought by
Burcham William and Burcham Sandra
Purchase Details
Closed on
Sep 2, 2015
Sold by
Wang Zhi Hua
Bought by
Muller Bruce
Purchase Details
Closed on
Aug 20, 2015
Sold by
Msbaker Llc
Bought by
Muller Bruce and Christensen Bethany Sue
Purchase Details
Closed on
Dec 19, 2008
Sold by
Muller Bruce and Christensen Bethany Sue
Bought by
Msbaker Llc
Purchase Details
Closed on
Oct 30, 2008
Sold by
Muller Bruce and Christensen Bethany Sue
Bought by
Muller Bruce and Christensen Bethany Sue
Create a Home Valuation Report for This Property
The Home Valuation Report is an in-depth analysis detailing your home's value as well as a comparison with similar homes in the area
Home Values in the Area
Average Home Value in this Area
Purchase History
| Date | Buyer | Sale Price | Title Company |
|---|---|---|---|
| Burcham William James | -- | None Available | |
| Burcham William James | -- | None Available | |
| Burcham William | $1,200,000 | First American Title Company | |
| Muller Bruce | -- | First American Title Company | |
| Muller Bruce | -- | First American Title Co | |
| Msbaker Llc | -- | None Available | |
| Muller Bruce | -- | None Available |
Source: Public Records
Tax History
| Year | Tax Paid | Tax Assessment Tax Assessment Total Assessment is a certain percentage of the fair market value that is determined by local assessors to be the total taxable value of land and additions on the property. | Land | Improvement |
|---|---|---|---|---|
| 2025 | $29,664 | $2,570,794 | $1,154,199 | $1,416,595 |
| 2024 | $29,664 | $2,520,387 | $1,131,568 | $1,388,819 |
| 2023 | $29,664 | $2,470,969 | $1,109,381 | $1,361,588 |
| 2022 | $28,783 | $2,422,520 | $1,087,629 | $1,334,891 |
| 2021 | $28,232 | $2,375,020 | $1,066,303 | $1,308,717 |
| 2020 | $28,191 | $2,350,668 | $1,055,370 | $1,295,298 |
| 2019 | $27,580 | $2,304,577 | $1,034,677 | $1,269,900 |
| 2018 | $27,293 | $2,259,390 | $1,014,390 | $1,245,000 |
| 2017 | $14,808 | $1,189,530 | $994,500 | $195,030 |
| 2016 | $14,348 | $1,200,000 | $975,000 | $225,000 |
| 2015 | -- | $259,916 | $129,958 | $129,958 |
| 2014 | $4,182 | $254,826 | $127,413 | $127,413 |
Source: Public Records
Map
Nearby Homes
Your Personal Tour Guide
Ask me questions while you tour the home.