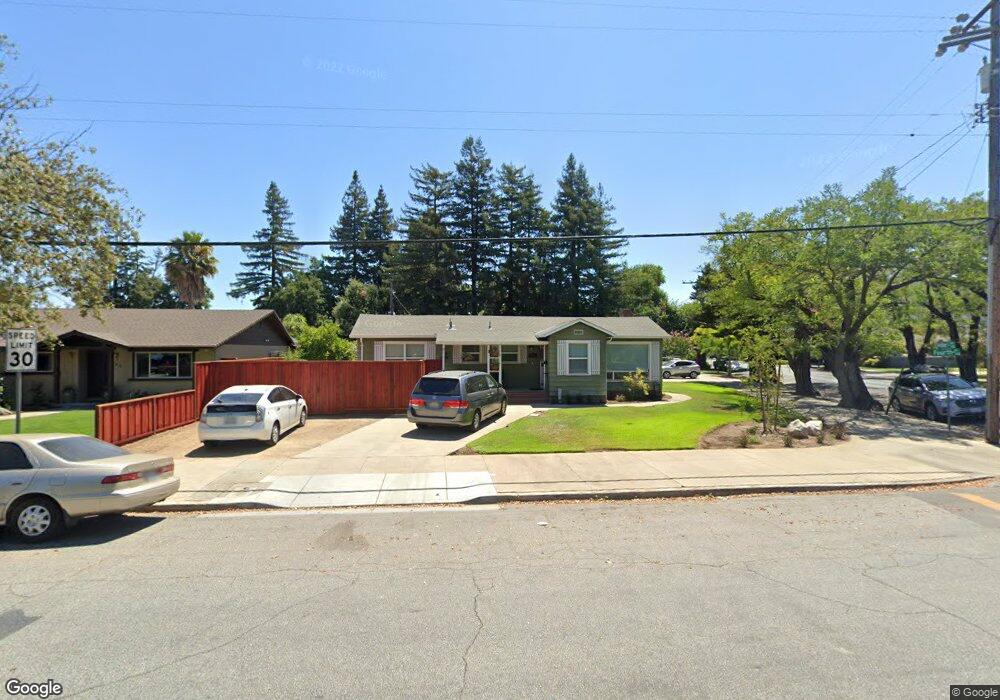
790 4th St Gilroy, CA 95020
Estimated Value: $1,058,000 - $1,304,000
3
Beds
2
Baths
2,312
Sq Ft
$494/Sq Ft
Est. Value
About This Home
This home is located at 790 4th St, Gilroy, CA 95020 and is currently estimated at $1,141,373, approximately $493 per square foot. 790 4th St is a home located in Santa Clara County with nearby schools including El Roble Elementary School, Brownell Middle School, and Solorsano Middle School.
Ownership History
Date
Name
Owned For
Owner Type
Purchase Details
Closed on
Apr 28, 2023
Sold by
Galindo Ephraim J and Galindo Angelisa M
Bought by
Ephraim J Galindo Jr And Angelisa M Galindo R
Current Estimated Value
Purchase Details
Closed on
Oct 24, 2018
Sold by
Galindo Mathew Richard and Galindo Ephraim
Bought by
Galindo Ephraim J and Galindo Angelisa M
Home Financials for this Owner
Home Financials are based on the most recent Mortgage that was taken out on this home.
Original Mortgage
$646,061
Interest Rate
4.5%
Mortgage Type
FHA
Purchase Details
Closed on
Nov 1, 2006
Sold by
Headley Patricia L and Elam Theresa
Bought by
Galindo Mathew Richard and Galindo Ephraim
Home Financials for this Owner
Home Financials are based on the most recent Mortgage that was taken out on this home.
Original Mortgage
$127,090
Interest Rate
6.28%
Mortgage Type
Stand Alone Second
Purchase Details
Closed on
Feb 10, 2006
Sold by
Headley Patricia L
Bought by
Headley Patricia L and Elam Theresa
Create a Home Valuation Report for This Property
The Home Valuation Report is an in-depth analysis detailing your home's value as well as a comparison with similar homes in the area
Home Values in the Area
Average Home Value in this Area
Purchase History
| Date | Buyer | Sale Price | Title Company |
|---|---|---|---|
| Ephraim J Galindo Jr And Angelisa M Galindo R | -- | None Listed On Document | |
| Galindo Ephraim J | $356,500 | Solidifi Title | |
| Galindo Mathew Richard | $635,500 | Chicago Title Company | |
| Headley Patricia L | -- | None Available |
Source: Public Records
Mortgage History
| Date | Status | Borrower | Loan Amount |
|---|---|---|---|
| Previous Owner | Galindo Ephraim J | $646,061 | |
| Previous Owner | Galindo Mathew Richard | $127,090 | |
| Previous Owner | Galindo Mathew Richard | $508,360 |
Source: Public Records
Tax History Compared to Growth
Tax History
| Year | Tax Paid | Tax Assessment Tax Assessment Total Assessment is a certain percentage of the fair market value that is determined by local assessors to be the total taxable value of land and additions on the property. | Land | Improvement |
|---|---|---|---|---|
| 2025 | $10,547 | $867,711 | $401,785 | $465,926 |
| 2024 | $10,547 | $850,698 | $393,907 | $456,791 |
| 2023 | $10,486 | $834,019 | $386,184 | $447,835 |
| 2022 | $10,315 | $817,666 | $378,612 | $439,054 |
| 2021 | $10,270 | $801,635 | $371,189 | $430,446 |
| 2020 | $9,887 | $772,000 | $357,400 | $414,600 |
| 2019 | $10,064 | $777,860 | $360,180 | $417,680 |
| 2018 | $10,145 | $824,238 | $412,119 | $412,119 |
| 2017 | $9,151 | $712,600 | $356,300 | $356,300 |
| 2016 | $8,557 | $666,000 | $333,000 | $333,000 |
| 2015 | $7,223 | $586,000 | $293,000 | $293,000 |
| 2014 | $7,086 | $567,000 | $283,500 | $283,500 |
Source: Public Records
Map
Nearby Homes
- 7681 Rea St
- 7379 Ailes Ct Unit Homesite 3
- 7391 Princevalle St Unit Homesite 13
- 7376 Ailes Ct Unit Homesite 10
- 7363 Ailes Ct Unit Homesite 5
- 7360 Ailes Ct Unit Homesite 8
- 7352 Ailes Ct Unit Homesite 7
- 7359 Princevalle St Unit Homesite 17
- 7351 Princevalle St Unit Homesite 18
- Plan 2 at Heritage on 6th Street
- Plan 1 at Heritage on 6th Street
- 7343 Princevalle St Unit Homesite 19
- 970 Ortega Cir
- 7245 Trenton Place
- 7630 Hanna St
- 7620 Santa Paula Dr
- 7305 Chadwick St
- 7609 Santa Paula Dr
- 286 5th St
- 7210 Yorktown Dr
- 780 4th St
- 7580 Miller Ave
- 90 Monte Vista Way
- 770 4th St
- 7591 Miller Ave
- 7600 Miller Ave
- 7581 Miller Ave
- 80 Monte Vista Way
- 7571 Miller Ave
- 7601 Miller Ave
- 7560 Miller Ave
- 7610 Miller Ave
- 7561 Miller Ave
- 791 4th St
- 6 Monte Vista Way
- 70 Monte Vista Way
- 5 Monte Vista Way
- 7621 Miller Ave
- 7540 Miller Ave
- 7551 Miller Ave