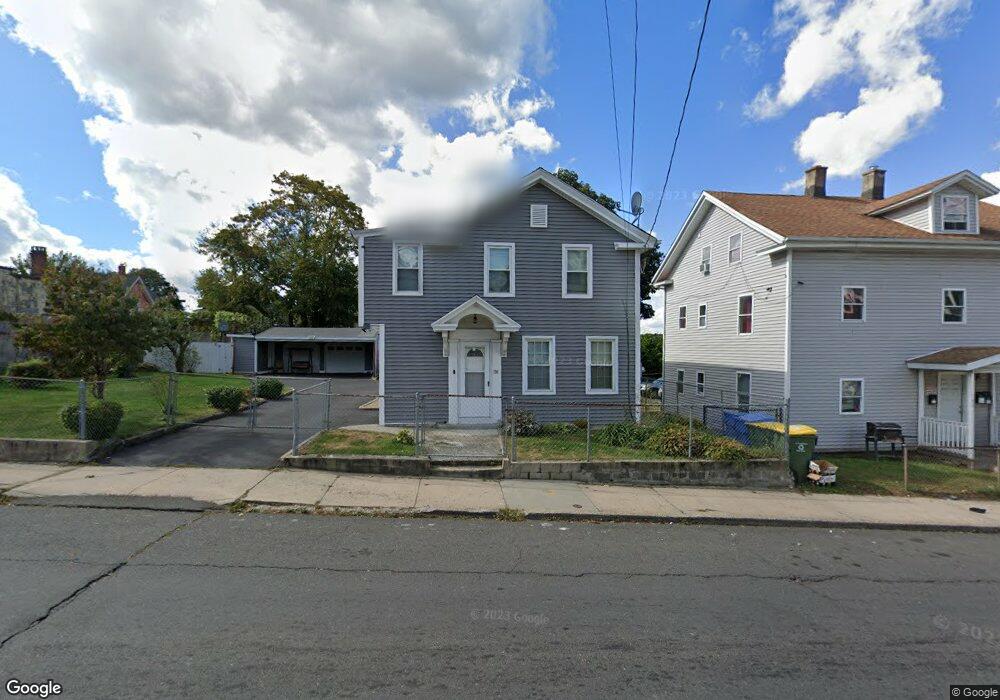
790 Baldwin St Waterbury, CT 06706
South End District NeighborhoodEstimated Value: $238,956 - $283,000
4
Beds
2
Baths
1,728
Sq Ft
$146/Sq Ft
Est. Value
About This Home
This home is located at 790 Baldwin St, Waterbury, CT 06706 and is currently estimated at $251,489, approximately $145 per square foot. 790 Baldwin St is a home located in New Haven County with nearby schools including Washington School, West Side Middle School, and John F. Kennedy High School.
Ownership History
Date
Name
Owned For
Owner Type
Purchase Details
Closed on
May 31, 2022
Sold by
Karimbaksh Nezam
Bought by
Karimbaksh Nezam and Karimbaksh Eseph
Current Estimated Value
Purchase Details
Closed on
Mar 9, 2021
Sold by
Ali Bibi
Bought by
Karimbaksh Nezam
Purchase Details
Closed on
Aug 31, 1998
Sold by
Sukhraj Haripersaud and Sukhraj Karmoon
Bought by
Ali Bibi and Baksh Nezam
Home Financials for this Owner
Home Financials are based on the most recent Mortgage that was taken out on this home.
Original Mortgage
$74,000
Interest Rate
6.57%
Mortgage Type
Purchase Money Mortgage
Purchase Details
Closed on
Dec 27, 1993
Sold by
Viotti Theresa and Marano Richard
Bought by
Marano Richard M
Home Financials for this Owner
Home Financials are based on the most recent Mortgage that was taken out on this home.
Original Mortgage
$59,350
Interest Rate
7%
Mortgage Type
Purchase Money Mortgage
Create a Home Valuation Report for This Property
The Home Valuation Report is an in-depth analysis detailing your home's value as well as a comparison with similar homes in the area
Home Values in the Area
Average Home Value in this Area
Purchase History
| Date | Buyer | Sale Price | Title Company |
|---|---|---|---|
| Karimbaksh Nezam | -- | None Available | |
| Karimbaksh Nezam | -- | None Available | |
| Ali Bibi | $78,000 | -- | |
| Marano Richard M | $60,000 | -- |
Source: Public Records
Mortgage History
| Date | Status | Borrower | Loan Amount |
|---|---|---|---|
| Previous Owner | Marano Richard M | $35,500 | |
| Previous Owner | Marano Richard M | $29,200 | |
| Previous Owner | Marano Richard M | $74,000 | |
| Previous Owner | Marano Richard M | $59,350 |
Source: Public Records
Tax History Compared to Growth
Tax History
| Year | Tax Paid | Tax Assessment Tax Assessment Total Assessment is a certain percentage of the fair market value that is determined by local assessors to be the total taxable value of land and additions on the property. | Land | Improvement |
|---|---|---|---|---|
| 2025 | $3,967 | $88,200 | $14,490 | $73,710 |
| 2024 | $4,361 | $88,200 | $14,490 | $73,710 |
| 2023 | $4,780 | $88,200 | $14,490 | $73,710 |
| 2022 | $2,949 | $48,980 | $14,500 | $34,480 |
| 2021 | $2,949 | $48,980 | $14,500 | $34,480 |
| 2020 | $2,949 | $48,980 | $14,500 | $34,480 |
| 2019 | $2,949 | $48,980 | $14,500 | $34,480 |
| 2018 | $2,949 | $48,980 | $14,500 | $34,480 |
| 2017 | $2,966 | $49,260 | $14,510 | $34,750 |
| 2016 | $2,966 | $49,260 | $14,510 | $34,750 |
| 2015 | $2,868 | $49,260 | $14,510 | $34,750 |
| 2014 | $2,868 | $49,260 | $14,510 | $34,750 |
Source: Public Records
Map
Nearby Homes
- 798 Baldwin St
- 780 Baldwin St
- 780 Baldwin St Unit 2FL
- 780 Baldwin St Unit 1 FL
- 65 South St
- 805 Baldwin St
- 816 Baldwin St
- 781 Baldwin St
- 75 South St
- 75 South St Unit 2nd
- 811 Baldwin St
- 818 Baldwin St
- 818 Baldwin St Unit 3FL
- 818 Baldwin St Unit 2nd FL
- 763 Baldwin St
- 79 South St
- 750 Baldwin St
- 826 Baldwin St
- 757 Baldwin St
- 757 Baldwin St Unit 1