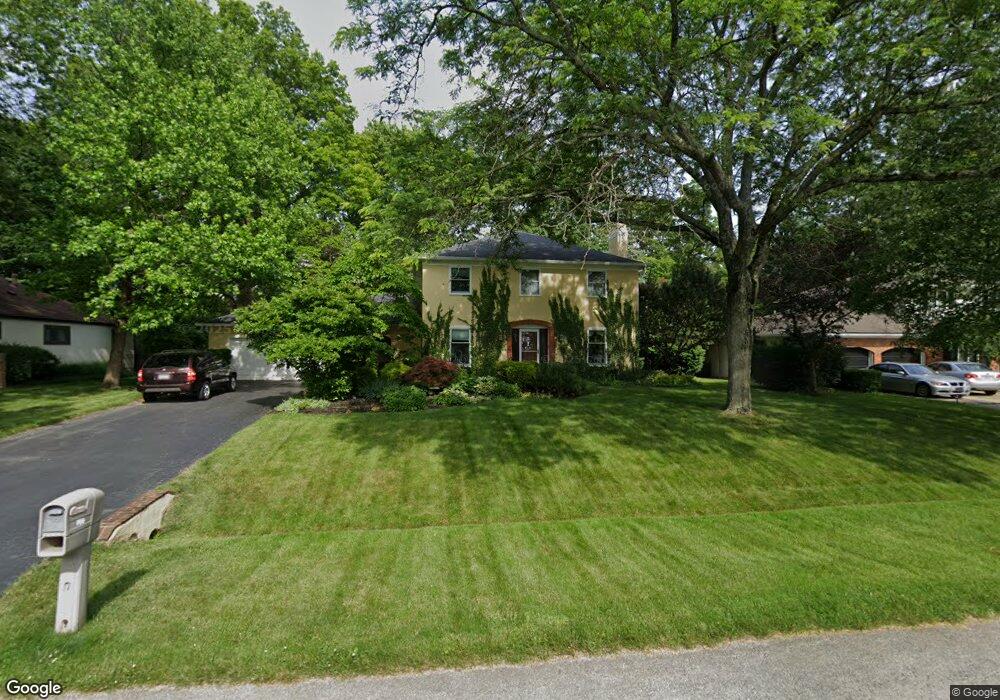
790 Persimmon Place Columbus, OH 43213
Olde Orchard NeighborhoodEstimated Value: $345,097 - $429,000
4
Beds
3
Baths
2,422
Sq Ft
$158/Sq Ft
Est. Value
About This Home
This home is located at 790 Persimmon Place, Columbus, OH 43213 and is currently estimated at $382,024, approximately $157 per square foot. 790 Persimmon Place is a home located in Franklin County with nearby schools including Olde Orchard Elementary School, Sherwood Middle School, and Walnut Ridge High School.
Ownership History
Date
Name
Owned For
Owner Type
Purchase Details
Closed on
May 30, 2006
Sold by
Moore Darin and Moore Dorene C
Bought by
Bradshaw Jerold and Bradshaw Sheilah
Current Estimated Value
Home Financials for this Owner
Home Financials are based on the most recent Mortgage that was taken out on this home.
Original Mortgage
$167,900
Outstanding Balance
$98,987
Interest Rate
6.62%
Mortgage Type
Fannie Mae Freddie Mac
Estimated Equity
$283,037
Purchase Details
Closed on
Oct 11, 2000
Sold by
Everhart Robert W and Everhart Anastasia
Bought by
Moore Darin and Moore Dorene C
Home Financials for this Owner
Home Financials are based on the most recent Mortgage that was taken out on this home.
Original Mortgage
$137,600
Interest Rate
8.03%
Purchase Details
Closed on
Apr 12, 1968
Bought by
Everhart Robert W
Create a Home Valuation Report for This Property
The Home Valuation Report is an in-depth analysis detailing your home's value as well as a comparison with similar homes in the area
Home Values in the Area
Average Home Value in this Area
Purchase History
| Date | Buyer | Sale Price | Title Company |
|---|---|---|---|
| Bradshaw Jerold | $209,900 | Chicago Tit | |
| Moore Darin | $172,000 | Transohio Title | |
| Everhart Robert W | -- | -- |
Source: Public Records
Mortgage History
| Date | Status | Borrower | Loan Amount |
|---|---|---|---|
| Open | Bradshaw Jerold | $167,900 | |
| Previous Owner | Moore Darin | $137,600 |
Source: Public Records
Tax History Compared to Growth
Tax History
| Year | Tax Paid | Tax Assessment Tax Assessment Total Assessment is a certain percentage of the fair market value that is determined by local assessors to be the total taxable value of land and additions on the property. | Land | Improvement |
|---|---|---|---|---|
| 2024 | $4,711 | $104,970 | $28,180 | $76,790 |
| 2023 | $4,651 | $104,965 | $28,175 | $76,790 |
| 2022 | $3,698 | $71,300 | $32,200 | $39,100 |
| 2021 | $3,705 | $71,300 | $32,200 | $39,100 |
| 2020 | $3,709 | $71,300 | $32,200 | $39,100 |
| 2019 | $3,722 | $61,360 | $28,000 | $33,360 |
| 2018 | $3,817 | $61,360 | $28,000 | $33,360 |
| 2017 | $4,019 | $61,360 | $28,000 | $33,360 |
| 2016 | $4,317 | $65,170 | $9,590 | $55,580 |
| 2015 | $3,919 | $65,170 | $9,590 | $55,580 |
| 2014 | $3,929 | $65,170 | $9,590 | $55,580 |
| 2013 | $1,845 | $62,055 | $9,135 | $52,920 |
Source: Public Records
Map
Nearby Homes
- 834 Persimmon Place
- 6258 Peach Tree Rd
- 6231 Peach Tree Rd
- 6483 Borr Ave
- 6526 Borr Ave
- 6279 Braiden Ct Unit 10B
- 6495 Balsam Dr
- 557 Woodingham Place Unit 1A
- 6626 Red Fox Rd
- 541 Woodingham Place Unit 2-C
- 696 Hunt Valley Dr
- 807 McNaughten Rd
- 6737 Rocky Den Rd
- 6056 Naughten Pond Dr
- 6052 Naughten Pond Dr
- 6040 Naughten Pond Dr
- 0 Rosehill Rd
- Oxford Plan at Icon Villas at McNaughten
- Ashton Plan at Icon Villas at McNaughten
- 856 Cummington Rd
- 776 Persimmon Place
- 804 Persimmon Place
- 801 Brice Rd
- 816 Persimmon Place
- 789 Brice Rd
- 6351 Peach Tree Rd
- 787 Persimmon Place
- 773 Persimmon Place
- 6315 Olde Orchard Dr
- 6369 Peach Tree Rd
- 815 Brice Rd
- 6323 Peach Tree Rd
- 828 Persimmon Place
- 6301 Olde Orchard Dr
- 6298 Olde Orchard Dr
- 825 Persimmon Place
- 806 Brice Rd
- 6307 Peach Tree Rd
- 780 Brice Rd
- 6350 Peach Tree Rd