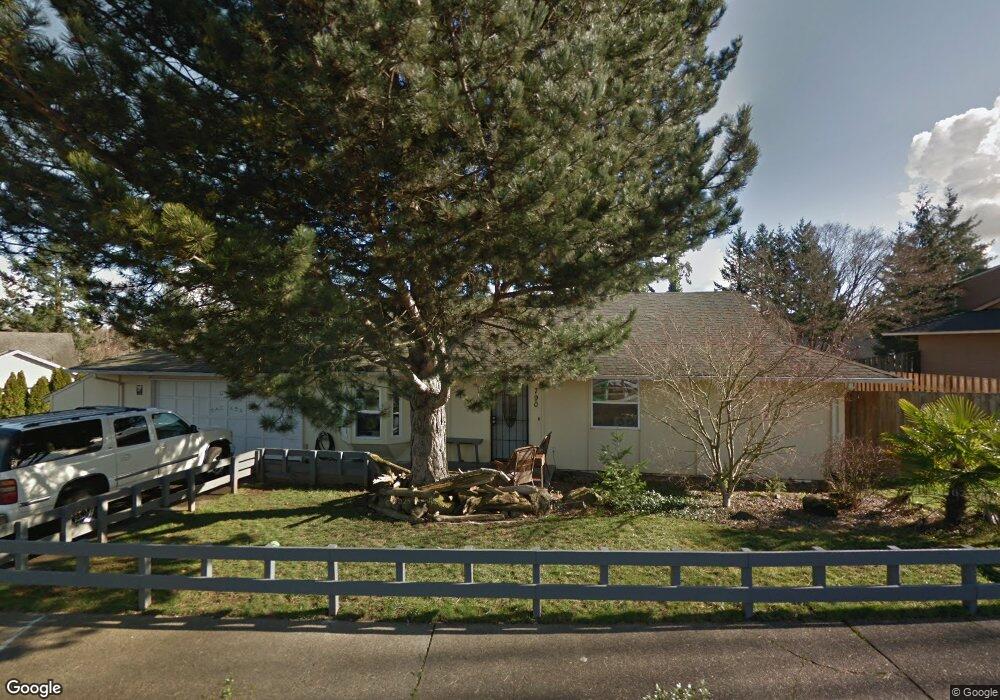
790 SE Barnes Ave Gresham, OR 97080
Powell Valley NeighborhoodEstimated Value: $452,000 - $482,000
3
Beds
2
Baths
1,874
Sq Ft
$249/Sq Ft
Est. Value
About This Home
This home is located at 790 SE Barnes Ave, Gresham, OR 97080 and is currently estimated at $466,753, approximately $249 per square foot. 790 SE Barnes Ave is a home located in Multnomah County with nearby schools including Powell Valley Elementary School, Gordon Russell Middle School, and Sam Barlow High School.
Ownership History
Date
Name
Owned For
Owner Type
Purchase Details
Closed on
Jan 15, 2021
Sold by
Garner Charles and Garner Charles J
Bought by
Garner Charles J and Garner Reina Marie
Current Estimated Value
Home Financials for this Owner
Home Financials are based on the most recent Mortgage that was taken out on this home.
Original Mortgage
$328,652
Outstanding Balance
$290,625
Interest Rate
2.71%
Mortgage Type
FHA
Estimated Equity
$176,128
Purchase Details
Closed on
Jul 24, 2014
Sold by
Garner Mindy S
Bought by
Garner Charles J
Purchase Details
Closed on
Aug 2, 2004
Sold by
Schiele David A
Bought by
Garner Charles and Garner Mindy
Home Financials for this Owner
Home Financials are based on the most recent Mortgage that was taken out on this home.
Original Mortgage
$149,200
Interest Rate
6.17%
Mortgage Type
Purchase Money Mortgage
Purchase Details
Closed on
Jun 1, 1999
Sold by
Schiele David A
Bought by
Schiele David A and Schiele Vicky A
Create a Home Valuation Report for This Property
The Home Valuation Report is an in-depth analysis detailing your home's value as well as a comparison with similar homes in the area
Home Values in the Area
Average Home Value in this Area
Purchase History
| Date | Buyer | Sale Price | Title Company |
|---|---|---|---|
| Garner Charles J | -- | Ticor Title Co | |
| Garner Charles J | -- | None Available | |
| Garner Charles | $186,500 | Chicago Title Co | |
| Schiele David A | -- | Oregon Title Insurance Co |
Source: Public Records
Mortgage History
| Date | Status | Borrower | Loan Amount |
|---|---|---|---|
| Open | Garner Charles J | $328,652 | |
| Previous Owner | Garner Charles | $149,200 | |
| Closed | Garner Charles | $37,300 |
Source: Public Records
Tax History
| Year | Tax Paid | Tax Assessment Tax Assessment Total Assessment is a certain percentage of the fair market value that is determined by local assessors to be the total taxable value of land and additions on the property. | Land | Improvement |
|---|---|---|---|---|
| 2025 | $4,911 | $241,310 | -- | -- |
| 2024 | $4,701 | $234,290 | -- | -- |
| 2023 | $4,283 | $227,470 | $0 | $0 |
| 2022 | $4,163 | $220,850 | $0 | $0 |
| 2021 | $4,058 | $214,420 | $0 | $0 |
| 2020 | $3,818 | $208,180 | $0 | $0 |
| 2019 | $3,718 | $202,120 | $0 | $0 |
| 2018 | $3,546 | $196,240 | $0 | $0 |
| 2017 | $3,402 | $190,530 | $0 | $0 |
| 2016 | $2,999 | $184,990 | $0 | $0 |
Source: Public Records
Map
Nearby Homes
- 0 SE Powell Valley Rd Unit 257585008
- 704 SE Greenway Dr
- 4355 SE 10th Dr
- 800 SE Greenway Dr
- 1230 SE Barnes Rd
- 3689 SE 14th St
- 4545 SE 3rd St
- 4724 SE Powell Valley Rd
- 3565 SE El Camino Dr
- 289 SE Acacia Dr
- 295 SE Baker Ave
- 4396 SE 1st Terrace
- 64 NE Scott Dr
- 195 SE Acacia Dr
- 191 SE Acacia Dr
- 205 SE Olvera Ave
- 3105 SE Powell Valley Rd
- 4668 SE 2nd St
- 4636 SE 2nd St
- 4690 SE 2nd St
- 778 SE Barnes Ave
- 762 SE Barnes Ave
- 3943 SE Powell Valley Rd
- 3925 SE Powell Valley Rd
- 746 SE Barnes Ave
- 765 SE Barnes Ave
- 3959 SE Powell Valley Rd
- 795 SE Barnes Ave
- 860 SE Barnes Ave
- 735 SE Barnes Ave
- 730 SE Barnes Ave
- 3977 SE Powell Valley Rd
- 779 SE Paloma Ave
- 829 SE Paloma Ave
- 805 SE Centurion Ave
- 780 SE Centurion Ave
- 747 SE Paloma Ave
- 865 SE Paloma Ave
- 0 SE Powell Valley Rd Unit 3 22077286
- 0 SE Powell Valley Rd Unit 3 22001191
Your Personal Tour Guide
Ask me questions while you tour the home.