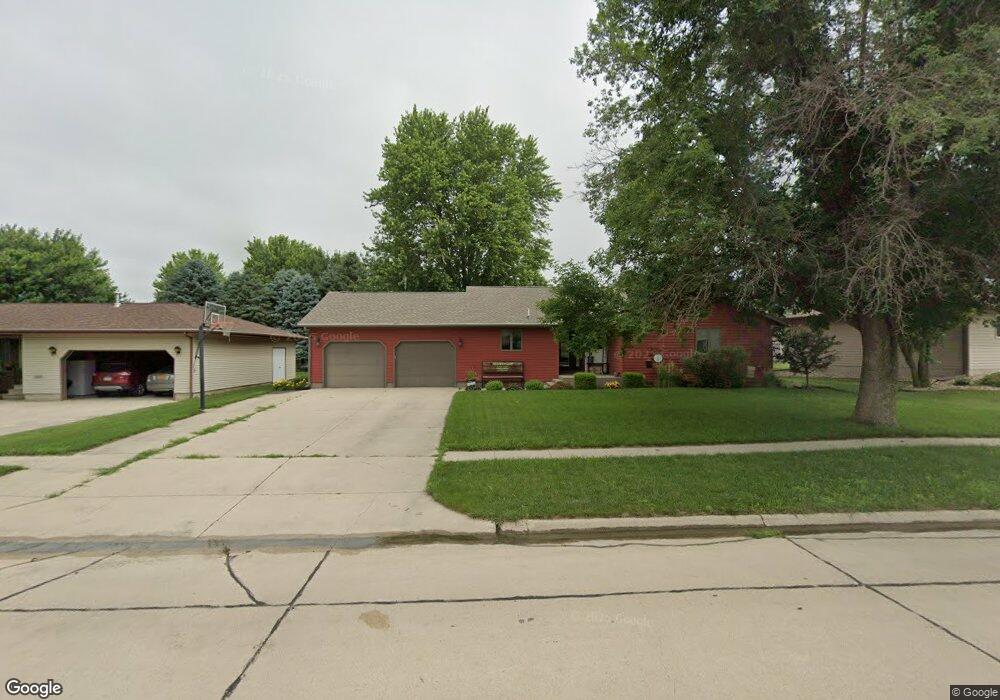
790 W 11th St Garner, IA 50438
Estimated Value: $299,000 - $337,000
3
Beds
2
Baths
1,645
Sq Ft
$193/Sq Ft
Est. Value
About This Home
This home is located at 790 W 11th St, Garner, IA 50438 and is currently estimated at $317,267, approximately $192 per square foot. 790 W 11th St is a home located in Hancock County with nearby schools including Garner-Hayfield-Ventura Elementary School and Garner-Hayfield-Ventura High School.
Ownership History
Date
Name
Owned For
Owner Type
Purchase Details
Closed on
Oct 19, 2006
Sold by
Cartus Financial Corp
Bought by
Frayne Bryan A and Frayne Cheila L
Current Estimated Value
Home Financials for this Owner
Home Financials are based on the most recent Mortgage that was taken out on this home.
Original Mortgage
$87,500
Interest Rate
6.27%
Mortgage Type
New Conventional
Purchase Details
Closed on
Apr 13, 2006
Sold by
Szymanski Thomas J and Szymanski Monica J
Bought by
Cendant Mobility Financial Corp
Create a Home Valuation Report for This Property
The Home Valuation Report is an in-depth analysis detailing your home's value as well as a comparison with similar homes in the area
Home Values in the Area
Average Home Value in this Area
Purchase History
| Date | Buyer | Sale Price | Title Company |
|---|---|---|---|
| Frayne Bryan A | $180,000 | None Available | |
| Cendant Mobility Financial Corp | $206,500 | None Available |
Source: Public Records
Mortgage History
| Date | Status | Borrower | Loan Amount |
|---|---|---|---|
| Previous Owner | Frayne Bryan A | $87,500 |
Source: Public Records
Tax History Compared to Growth
Tax History
| Year | Tax Paid | Tax Assessment Tax Assessment Total Assessment is a certain percentage of the fair market value that is determined by local assessors to be the total taxable value of land and additions on the property. | Land | Improvement |
|---|---|---|---|---|
| 2025 | $4,520 | $328,150 | $33,280 | $294,870 |
| 2024 | $4,520 | $305,600 | $24,960 | $280,640 |
| 2023 | $4,542 | $305,600 | $24,960 | $280,640 |
| 2022 | $3,916 | $271,740 | $24,960 | $246,780 |
| 2021 | $3,798 | $228,260 | $24,960 | $203,300 |
| 2020 | $3,798 | $207,660 | $24,960 | $182,700 |
| 2019 | $3,504 | $207,660 | $24,960 | $182,700 |
| 2018 | $3,242 | $189,740 | $24,960 | $164,780 |
| 2017 | $3,148 | $182,020 | $0 | $0 |
| 2016 | $3,032 | $182,020 | $0 | $0 |
| 2015 | $3,032 | $180,410 | $0 | $0 |
| 2014 | $2,948 | $180,410 | $0 | $0 |
Source: Public Records
Map
Nearby Homes
- 970 Cobblestone Ln
- 965 Cobblestone Ln
- 750 Pebblestone Ln
- 490 W 11th St
- 640 W Lyons St
- 1065 Center Ave
- 760 W 7th St
- 780 W 5th St
- 1044 Bush Ave
- 1050 Bush Ave
- 320 W 8th St
- 1330 Bush Ave
- 495 W 5th St
- 1145 State St
- 390 W 5th St
- 1440 State St Unit 1450
- 490 Allen Ave
- 340 Bush Ave
- 335 E Lyons St
- 645 Maben Ave
- 790 W 11th St
- 820 W 11th St
- 780 W 11th St
- 735 Cobblestone Dr
- 760 W 11th St
- 840 W 11th St
- 795 W 11th St
- 825 W 11th St
- 860 W 11th St
- 725 Cobblestone Dr
- 745 Cobblestone Dr
- 710 11th Street Place
- 865 W 11th St
- 755 Cobblestone Dr
- 765 W 11th St
- 1080 Pebblestone St
- 880 W 11th St
- 730 Cobblestone Dr
- 730 Cobblestone Dr
- 760 11th Street Place