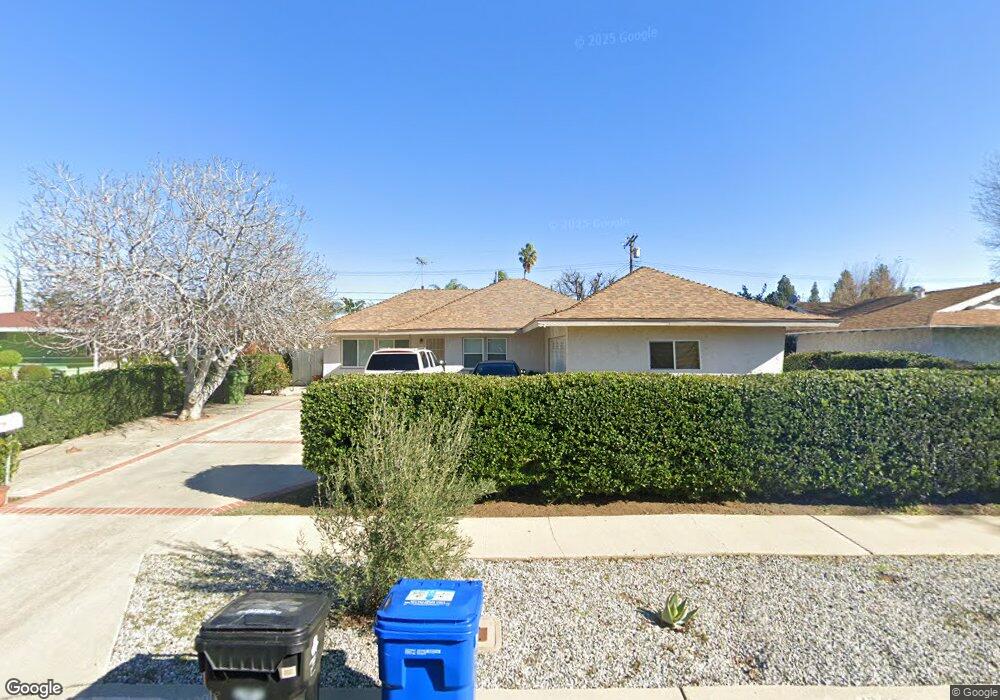
7900 Ducor Ave Canoga Park, CA 91304
Canoga Park NeighborhoodEstimated Value: $773,000 - $814,000
3
Beds
2
Baths
1,165
Sq Ft
$681/Sq Ft
Est. Value
About This Home
This home is located at 7900 Ducor Ave, Canoga Park, CA 91304 and is currently estimated at $793,717, approximately $681 per square foot. 7900 Ducor Ave is a home located in Los Angeles County with nearby schools including Christopher Columbus Middle School, Canoga Park Senior High School, and Justice Street Academy Charter.
Ownership History
Date
Name
Owned For
Owner Type
Purchase Details
Closed on
Oct 15, 2004
Sold by
Dafesh Maha Samir
Bought by
Dafesh Samir Anton
Current Estimated Value
Home Financials for this Owner
Home Financials are based on the most recent Mortgage that was taken out on this home.
Original Mortgage
$209,000
Interest Rate
5.74%
Mortgage Type
New Conventional
Purchase Details
Closed on
Nov 18, 2002
Sold by
Dafesh Samir and Dafesh Samir Anton
Bought by
Dafesh Maha Samir
Home Financials for this Owner
Home Financials are based on the most recent Mortgage that was taken out on this home.
Original Mortgage
$224,000
Interest Rate
6.12%
Purchase Details
Closed on
Dec 11, 2000
Sold by
Maccauley Gary and Maccauley Peter
Bought by
Dafesh Samir Anton
Home Financials for this Owner
Home Financials are based on the most recent Mortgage that was taken out on this home.
Original Mortgage
$166,400
Interest Rate
6.89%
Create a Home Valuation Report for This Property
The Home Valuation Report is an in-depth analysis detailing your home's value as well as a comparison with similar homes in the area
Home Values in the Area
Average Home Value in this Area
Purchase History
| Date | Buyer | Sale Price | Title Company |
|---|---|---|---|
| Dafesh Samir Anton | -- | Financial Title Company La | |
| Dafesh Maha Samir | -- | Gateway Title Company | |
| Dafesh Samir Anton | $208,000 | South Coast Title |
Source: Public Records
Mortgage History
| Date | Status | Borrower | Loan Amount |
|---|---|---|---|
| Closed | Dafesh Samir Anton | $209,000 | |
| Closed | Dafesh Maha Samir | $224,000 | |
| Previous Owner | Dafesh Samir Anton | $166,400 |
Source: Public Records
Tax History Compared to Growth
Tax History
| Year | Tax Paid | Tax Assessment Tax Assessment Total Assessment is a certain percentage of the fair market value that is determined by local assessors to be the total taxable value of land and additions on the property. | Land | Improvement |
|---|---|---|---|---|
| 2025 | $4,041 | $313,400 | $250,728 | $62,672 |
| 2024 | $4,041 | $307,256 | $245,812 | $61,444 |
| 2023 | $3,968 | $301,233 | $240,993 | $60,240 |
| 2022 | $3,791 | $295,327 | $236,268 | $59,059 |
| 2021 | $3,743 | $289,537 | $231,636 | $57,901 |
| 2019 | $3,637 | $280,951 | $224,766 | $56,185 |
| 2018 | $3,533 | $275,443 | $220,359 | $55,084 |
| 2016 | $3,373 | $264,749 | $211,803 | $52,946 |
| 2015 | $3,326 | $260,773 | $208,622 | $52,151 |
| 2014 | $3,345 | $255,666 | $204,536 | $51,130 |
Source: Public Records
Map
Nearby Homes
- 7925 Royer Ave
- 7932 Woodlake Ave
- 23200 Justice St
- 8108 Royer Ave
- 7729 Sedan Ave
- 22906 Lanark St
- 8225 Fallbrook Ave
- 8208 Fallbrook Ave
- 22700 Baltar St
- 7635 Fallbrook Ave
- 22715 Keswick St
- 8324 Joan Ln
- 23025 Covello St
- 8373 Denise Ln
- 22836 Covello St
- 7446 Woodlake Ave
- 8404 Joan Ln
- 7435 Lena Ave
- 7556 Chaminade Ave
- 7442 Bobbyboyar Ave
- 7908 Ducor Ave
- 7858 Ducor Ave
- 23022 Blythe St
- 23023 Arminta St
- 7916 Ducor Ave
- 7852 Ducor Ave
- 23014 Blythe St
- 23015 Arminta St
- 7909 Ducor Ave
- 7859 Ducor Ave
- 23021 Blythe St
- 7844 Ducor Ave
- 7917 Ducor Ave
- 7853 Ducor Ave
- 23020 Arminta St
- 23008 Blythe St
- 23009 Arminta St
- 7923 7925 Ducor Ave
- 7925 Ducor Ave
- 7923 Ducor Ave