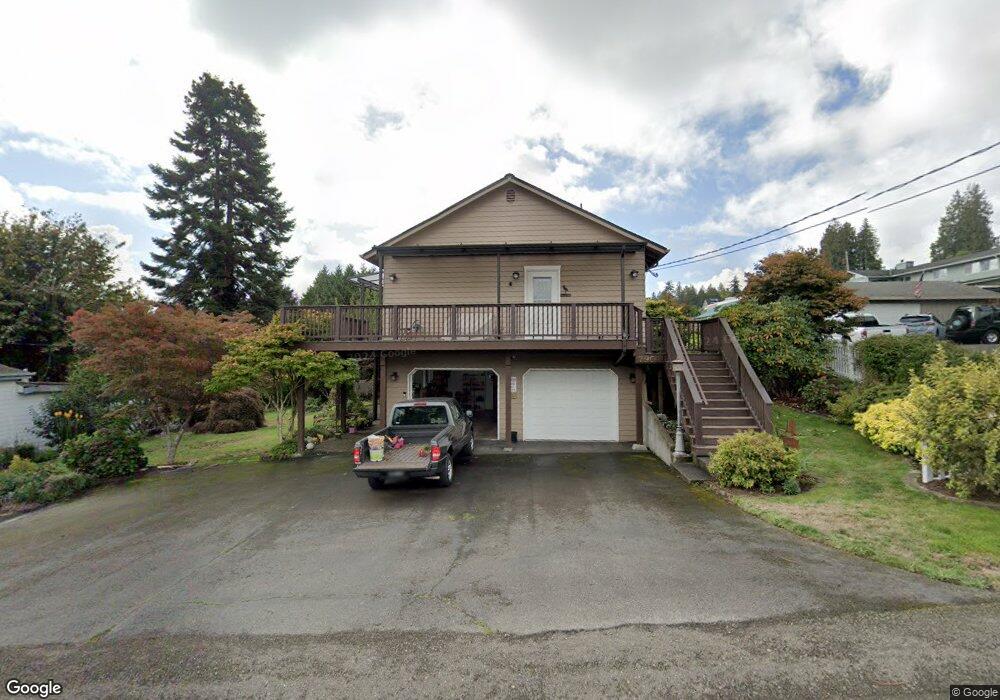
7900 E Maple St Port Orchard, WA 98366
Manchester NeighborhoodEstimated Value: $797,258 - $963,000
4
Beds
3
Baths
1,748
Sq Ft
$521/Sq Ft
Est. Value
About This Home
This home is located at 7900 E Maple St, Port Orchard, WA 98366 and is currently estimated at $910,315, approximately $520 per square foot. 7900 E Maple St is a home with nearby schools including Manchester Elementary School, John Sedgwick Middle School, and South Kitsap High School.
Ownership History
Date
Name
Owned For
Owner Type
Purchase Details
Closed on
Feb 18, 1997
Sold by
Ewing Sharon D
Bought by
Campbell Carol J
Current Estimated Value
Create a Home Valuation Report for This Property
The Home Valuation Report is an in-depth analysis detailing your home's value as well as a comparison with similar homes in the area
Home Values in the Area
Average Home Value in this Area
Purchase History
| Date | Buyer | Sale Price | Title Company |
|---|---|---|---|
| Campbell Carol J | $205,000 | Stewart Title Company |
Source: Public Records
Tax History Compared to Growth
Tax History
| Year | Tax Paid | Tax Assessment Tax Assessment Total Assessment is a certain percentage of the fair market value that is determined by local assessors to be the total taxable value of land and additions on the property. | Land | Improvement |
|---|---|---|---|---|
| 2026 | $6,710 | $783,110 | $177,840 | $605,270 |
| 2025 | $6,710 | $783,110 | $177,840 | $605,270 |
| 2024 | $6,505 | $783,110 | $177,840 | $605,270 |
| 2023 | $6,459 | $783,110 | $177,840 | $605,270 |
| 2022 | $6,184 | $627,470 | $142,030 | $485,440 |
| 2021 | $5,709 | $547,500 | $123,500 | $424,000 |
| 2020 | $5,425 | $505,290 | $87,730 | $417,560 |
| 2019 | $4,666 | $478,400 | $82,930 | $395,470 |
| 2018 | $4,881 | $372,440 | $71,970 | $300,470 |
| 2017 | $4,007 | $372,440 | $71,970 | $300,470 |
| 2016 | $3,899 | $331,450 | $68,540 | $262,910 |
| 2015 | $3,770 | $324,820 | $68,540 | $256,280 |
| 2014 | -- | $331,910 | $76,450 | $255,460 |
| 2013 | -- | $331,910 | $76,450 | $255,460 |
Source: Public Records
Map
Nearby Homes
- 2372 Valley Ave E
- 8079 E Main St Unit 341
- 7748 E Hemlock St
- 7549 E Alki View Ct
- 2440 Alaska Ave E
- 2585 Alaska Ave E
- 6418 E Royalview Ln
- 7548 E Grandview St
- 7230 E Maple St
- 1630 & 1632 Colchester Dr E
- 7590 E Idaho St
- 8471 E Caraway Rd
- 8623 E Caraway Rd
- 8009 E Commons Ct
- 7569 E Montana St
- 7579 E Idaho St
- 7260 E Last Refuge Way
- 8609 E Caraway Rd
- 1738 Lilypad Place E
- 1083 Puget Dr E
- 7884 E Maple St
- 7905 E Spruce St
- 7934 E Maple St
- 7947 E Spruce St
- 7911 E Maple St
- 2196 E Spring St
- 2212 E Spring St
- 7841 E Spruce St
- 7897 E Maple St
- 2212 Spring St E
- 7832 E Maple St
- 7831 E Spruce St
- 0 Spring (The Rainier) St E Unit 618824
- 0 Spring (The Alki) St E Unit 618820
- 0 Spring (The Blakely) St E Unit 618813
- 0 Spring (The Skyline Suite) St E Unit 618810
- 0 Spring (Baker Suite) St E Unit 618756
- 7821 E Maple St
- 7918 E Fir St
- 7918 E Spruce St