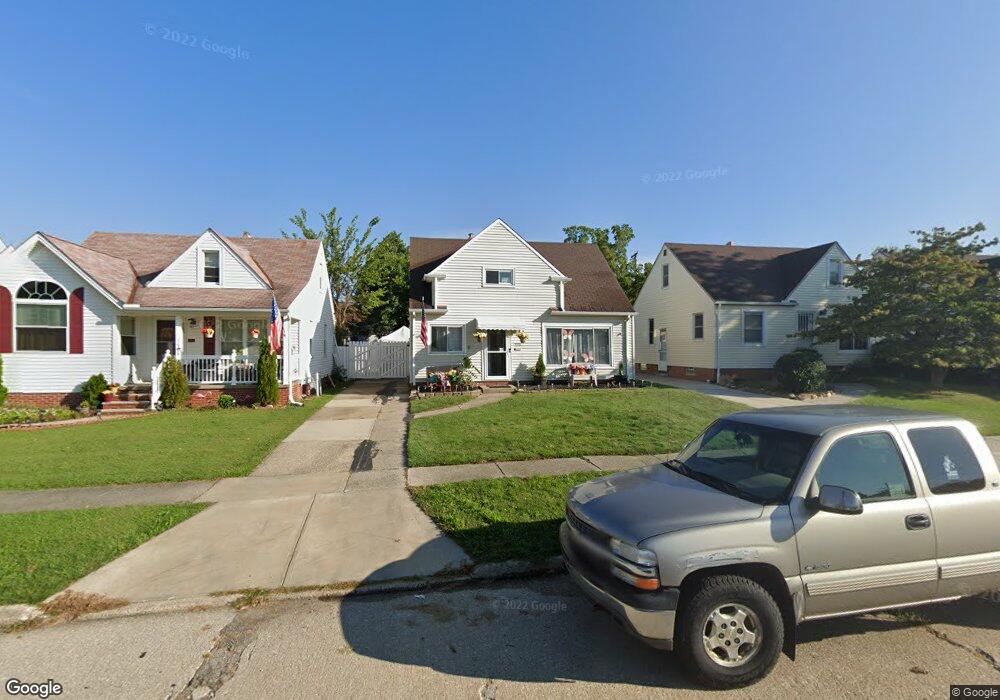
7902 Newport Ave Cleveland, OH 44129
Estimated Value: $165,048 - $203,000
3
Beds
1
Bath
1,092
Sq Ft
$163/Sq Ft
Est. Value
About This Home
This home is located at 7902 Newport Ave, Cleveland, OH 44129 and is currently estimated at $177,512, approximately $162 per square foot. 7902 Newport Ave is a home located in Cuyahoga County with nearby schools including Ridge-Brook Elementary School, Greenbriar Middle School, and Parma High School.
Ownership History
Date
Name
Owned For
Owner Type
Purchase Details
Closed on
May 24, 2022
Sold by
Tetlak Susan E and Tetlak Mark T
Bought by
Azzano Harry J and Azzano Connie L
Current Estimated Value
Home Financials for this Owner
Home Financials are based on the most recent Mortgage that was taken out on this home.
Original Mortgage
$103,098
Outstanding Balance
$97,718
Interest Rate
5%
Mortgage Type
FHA
Estimated Equity
$79,794
Purchase Details
Closed on
Sep 26, 2001
Sold by
Riley Genevieve Marie
Bought by
Tetlak Mark T
Home Financials for this Owner
Home Financials are based on the most recent Mortgage that was taken out on this home.
Original Mortgage
$88,301
Interest Rate
6.97%
Mortgage Type
FHA
Purchase Details
Closed on
Mar 1, 1977
Sold by
Nye Jules and Nye Rita K
Bought by
Riley Genevieve Marie
Purchase Details
Closed on
Jan 1, 1975
Bought by
Nye Jules and Nye Rita K
Create a Home Valuation Report for This Property
The Home Valuation Report is an in-depth analysis detailing your home's value as well as a comparison with similar homes in the area
Home Values in the Area
Average Home Value in this Area
Purchase History
| Date | Buyer | Sale Price | Title Company |
|---|---|---|---|
| Azzano Harry J | $105,000 | New Title Company Name | |
| Tetlak Mark T | $89,000 | American Title & Trust Agenc | |
| Riley Genevieve Marie | $31,400 | -- | |
| Nye Jules | -- | -- |
Source: Public Records
Mortgage History
| Date | Status | Borrower | Loan Amount |
|---|---|---|---|
| Open | Azzano Harry J | $103,098 | |
| Previous Owner | Tetlak Mark T | $88,301 |
Source: Public Records
Tax History Compared to Growth
Tax History
| Year | Tax Paid | Tax Assessment Tax Assessment Total Assessment is a certain percentage of the fair market value that is determined by local assessors to be the total taxable value of land and additions on the property. | Land | Improvement |
|---|---|---|---|---|
| 2024 | $1,705 | $44,415 | $9,940 | $34,475 |
| 2023 | $1,430 | $35,910 | $8,190 | $27,720 |
| 2022 | $2,574 | $35,910 | $8,190 | $27,720 |
| 2021 | $2,646 | $35,910 | $8,190 | $27,720 |
| 2020 | $2,322 | $27,620 | $6,300 | $21,320 |
| 2019 | $2,217 | $78,900 | $18,000 | $60,900 |
| 2018 | $2,230 | $27,620 | $6,300 | $21,320 |
| 2017 | $2,017 | $23,100 | $4,410 | $18,690 |
| 2016 | $2,006 | $23,100 | $4,410 | $18,690 |
| 2015 | $1,964 | $23,100 | $4,410 | $18,690 |
| 2014 | $1,964 | $24,570 | $4,690 | $19,880 |
Source: Public Records
Map
Nearby Homes
- 7707 Liberty Ave
- 8206 Newport Ave
- 8018 Pinegrove Ave
- 8119 Pinegrove Ave
- 6606 Theota Ave
- 9118 Fernhill Ave
- 7609 Wooster Pkwy
- 6211 Luelda Ave
- 6014 Laverne Ave
- 9417 Fernhill Ave
- 5717 Chestnut Dr
- 6508 Delora Ave
- 5906 Velma Ave
- 6011 Theota Ave
- 7910 Dresden Ave
- 6306 Flowerdale Ave
- 5810 Laverne Ave
- 6903 Forest Ave
- 6711 Forest Ave
- 7600 Dresden Ave
- 7810 Newport Ave
- 7906 Newport Ave
- 7806 Newport Ave
- 7910 Newport Ave
- 7802 Newport Ave
- 7914 Newport Ave
- 7903 Liberty Ave
- 7811 Liberty Ave
- 7907 Liberty Ave
- 7911 Liberty Ave
- 7807 Liberty Ave
- 7918 Newport Ave
- 7803 Liberty Ave
- 7903 Newport Ave
- 7811 Newport Ave
- 7907 Newport Ave
- 7911 Newport Ave
- 7807 Newport Ave
- 7919 Liberty Ave
- 7922 Newport Ave