Estimated Value: $497,000 - $624,000
3
Beds
2
Baths
2,376
Sq Ft
$228/Sq Ft
Est. Value
About This Home
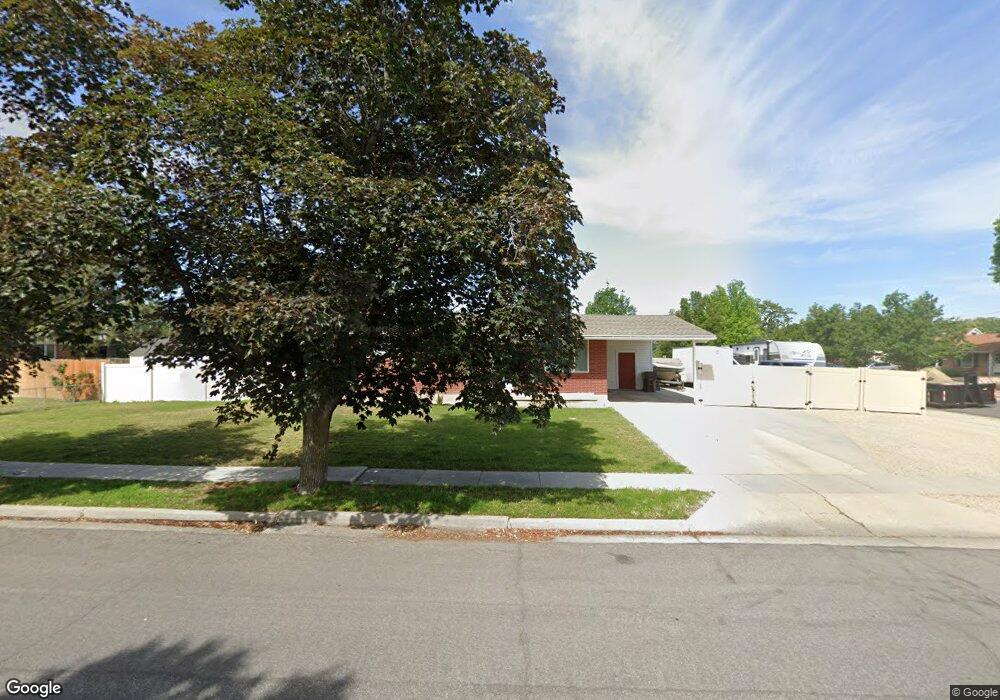
This home is located at 7902 S 280 E, Sandy, UT 84070 and is currently estimated at $540,997, approximately $227 per square foot. 7902 S 280 E is a home located in Salt Lake County with nearby schools including Midvalley Elementary School, Union Middle School, and Hillcrest High School.
Ownership History
Date
Name
Owned For
Owner Type
Purchase Details
Closed on
Jul 22, 2021
Sold by
Kammeyer Quin
Bought by
Red Brick House Llc
Current Estimated Value
Home Financials for this Owner
Home Financials are based on the most recent Mortgage that was taken out on this home.
Original Mortgage
$315,000
Outstanding Balance
$286,075
Interest Rate
2.96%
Mortgage Type
New Conventional
Estimated Equity
$254,922
Purchase Details
Closed on
Jul 21, 2021
Sold by
Clark Jack W and Clark Family Living Trust
Bought by
Kammeyer Quin
Home Financials for this Owner
Home Financials are based on the most recent Mortgage that was taken out on this home.
Original Mortgage
$315,000
Outstanding Balance
$286,075
Interest Rate
2.96%
Mortgage Type
New Conventional
Estimated Equity
$254,922
Purchase Details
Closed on
Aug 3, 2001
Sold by
Clark Jack W and Clark Leann
Bought by
Clark Jack W
Purchase Details
Closed on
Oct 3, 1994
Sold by
Clark Leann
Bought by
Clark Jack W
Create a Home Valuation Report for This Property
The Home Valuation Report is an in-depth analysis detailing your home's value as well as a comparison with similar homes in the area
Home Values in the Area
Average Home Value in this Area
Purchase History
| Date | Buyer | Sale Price | Title Company |
|---|---|---|---|
| Red Brick House Llc | -- | Titan Title Ins Agcy Inc | |
| Kammeyer Quin | -- | Rudd & Hawkers Ttl Ins Agcy | |
| Clark Jack W | -- | Backman Stewart Title Servic | |
| Clark Jack W | -- | -- |
Source: Public Records
Mortgage History
| Date | Status | Borrower | Loan Amount |
|---|---|---|---|
| Open | Kammeyer Quin | $315,000 |
Source: Public Records
Tax History
| Year | Tax Paid | Tax Assessment Tax Assessment Total Assessment is a certain percentage of the fair market value that is determined by local assessors to be the total taxable value of land and additions on the property. | Land | Improvement |
|---|---|---|---|---|
| 2025 | $2,762 | $460,700 | $130,000 | $330,700 |
| 2024 | $2,762 | $453,400 | $122,200 | $331,200 |
| 2023 | $2,571 | $418,300 | $116,100 | $302,200 |
| 2022 | $2,705 | $429,800 | $113,900 | $315,900 |
| 2021 | $2,262 | $307,400 | $99,000 | $208,400 |
| 2020 | $2,153 | $276,900 | $80,200 | $196,700 |
| 2019 | $2,087 | $261,500 | $80,200 | $181,300 |
Source: Public Records
Map
Nearby Homes
- 7824 S 280 E
- 397 E Tractor Dr Unit 103
- 379 E Horse Creek Dr
- 393 E Corral Creek Dr
- 190 E White Spruce Cove Unit 805
- 330 E 7635 S Unit 344
- 350 E 7635 South St
- 354 E 7635 South St
- 257 E Water Mill Way
- 257 Water Mill Way Unit 211
- 7613 S 300 E
- 274 E Water Mill Way Unit 230
- 7359 S Dewmar Ct W Unit 32
- 489 E 7800 S Unit 2
- 7363 S Dewmar Ct W Unit 33
- 7342 S Seven Tree Ln W Unit 77
- 7329 S Seven Tree Ln W Unit 85
- 7371 S Dewmar Ct W Unit 35
- 7327 S Seven Tree Ln W Unit 86
- 7337 S Seven Tree Ln W Unit 82
- 266 E 7890 S
- 7920 S 280 E
- 265 Tennyson Ave
- 7895 S 280 E
- 7907 S 280 E
- 7874 S 280 E
- 265 E 7890 S
- 7883 S 280 E
- 289 Tennyson Ave
- 289 E Tennyson Ave
- 255 Tennyson Ave
- 255 E Tennyson Ave Unit 255 E Tennyson Ave
- 255 E Tennyson Ave
- 263 E Brady Ln
- 263 E 7890 S
- 252 E 7890 S
- 7871 S 280 E
- 245 Tennyson Ave
- 245 E 7930 S
- 274 Tennyson Ave
Your Personal Tour Guide
Ask me questions while you tour the home.