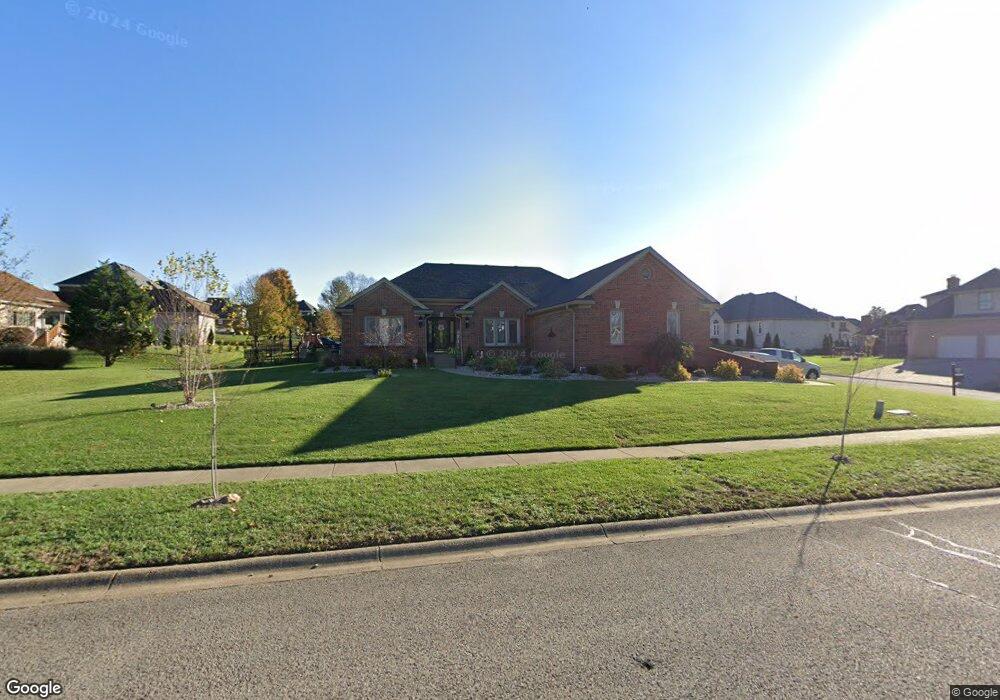
7903 Hall Farm Dr Louisville, KY 40291
Estimated Value: $404,000 - $476,000
3
Beds
3
Baths
2,728
Sq Ft
$158/Sq Ft
Est. Value
About This Home
This home is located at 7903 Hall Farm Dr, Louisville, KY 40291 and is currently estimated at $430,432, approximately $157 per square foot. 7903 Hall Farm Dr is a home located in Jefferson County with nearby schools including Wilt Elementary School, Bates Elementary School, and Fern Creek Elementary School.
Ownership History
Date
Name
Owned For
Owner Type
Purchase Details
Closed on
Nov 28, 2018
Sold by
Korfhage Gary R
Bought by
Walker Michael T and Walker Nancy S
Current Estimated Value
Home Financials for this Owner
Home Financials are based on the most recent Mortgage that was taken out on this home.
Original Mortgage
$10,000
Interest Rate
4.8%
Mortgage Type
Future Advance Clause Open End Mortgage
Purchase Details
Closed on
Nov 15, 2018
Sold by
Booker Melvin J
Bought by
Korfhage Gary R
Home Financials for this Owner
Home Financials are based on the most recent Mortgage that was taken out on this home.
Original Mortgage
$10,000
Interest Rate
4.8%
Mortgage Type
Future Advance Clause Open End Mortgage
Purchase Details
Closed on
Nov 14, 2011
Sold by
Blum Gail J
Bought by
Booker Melvin L and Booker Karen
Home Financials for this Owner
Home Financials are based on the most recent Mortgage that was taken out on this home.
Original Mortgage
$254,500
Interest Rate
4.02%
Mortgage Type
VA
Create a Home Valuation Report for This Property
The Home Valuation Report is an in-depth analysis detailing your home's value as well as a comparison with similar homes in the area
Home Values in the Area
Average Home Value in this Area
Purchase History
| Date | Buyer | Sale Price | Title Company |
|---|---|---|---|
| Walker Michael T | $232,000 | Kentucky Title Services | |
| Korfhage Gary R | $214,000 | Kentucky Title Services | |
| Booker Melvin L | $254,500 | Executive Title |
Source: Public Records
Mortgage History
| Date | Status | Borrower | Loan Amount |
|---|---|---|---|
| Closed | Walker Michael T | $10,000 | |
| Previous Owner | Booker Melvin L | $254,500 |
Source: Public Records
Tax History Compared to Growth
Tax History
| Year | Tax Paid | Tax Assessment Tax Assessment Total Assessment is a certain percentage of the fair market value that is determined by local assessors to be the total taxable value of land and additions on the property. | Land | Improvement |
|---|---|---|---|---|
| 2024 | $3,968 | $346,530 | $72,100 | $274,430 |
| 2023 | $3,330 | $282,660 | $72,100 | $210,560 |
| 2022 | $3,341 | $282,660 | $72,100 | $210,560 |
| 2021 | $3,577 | $282,660 | $72,100 | $210,560 |
| 2020 | $3,355 | $285,060 | $72,100 | $212,960 |
| 2019 | $2,514 | $232,000 | $75,000 | $157,000 |
| 2018 | $2,828 | $264,170 | $75,000 | $189,170 |
| 2017 | $2,772 | $264,170 | $75,000 | $189,170 |
| 2013 | $2,545 | $254,500 | $49,000 | $205,500 |
Source: Public Records
Map
Nearby Homes
- 7606 Kendrick Crossing Ln
- 10916 Blacksmith Rd
- 7807 Firescale Cir
- 7901 Copper Drift Way
- 7820 Copper Drift Way
- 7933 Copper Drift Way
- 7925 Copper Drift Way
- 7824 Copper Drift Way
- 7821 Copper Drift Way
- 7815 Firescale Ct
- 7909 Kendrick Crossing Ln
- 7819 Copper Drift Way
- 7829 Copper Drift Way
- 7831 Copper Drift Way
- The Dover Glen - Elan Series Plan at Glenmary Farms - Elan Series at Glenmary Farms
- The Barclay Point - Elan Series Plan at Glenmary Farms - Elan Series at Glenmary Farms
- The Laurel Square - Elan Series Plan at Glenmary Farms - Elan Series at Glenmary Farms
- The Oak Bluff - Elan Series Plan at Glenmary Farms - Elan Series at Glenmary Farms
- The Granite Coast - Elan Series Plan at Glenmary Farms - Elan Series at Glenmary Farms
- The Haywood Park - Elan Series Plan at Glenmary Farms - Elan Series at Glenmary Farms
- 10703 Chain Ivy Ct
- 7901 Hall Farm Dr
- 10702 Briar Turn Dr
- 10705 Chain Ivy Ct
- 7904 Hall Farm Dr
- 7913 Hall Farm Dr
- 7906 Hall Farm Dr
- 10702 Chain Ivy Ct
- 7902 Hall Farm Dr
- 10704 Briar Turn Dr
- 7908 Hall Farm Dr
- 7900 Hall Farm Dr
- 10707 Chain Ivy Ct
- 10704 Chain Ivy Ct
- 7910 Hall Farm Dr
- 10706 Briar Turn Dr
- 7915 Hall Farm Dr
- 10703 Briar Turn Dr
- 7812 Hall Farm Dr
- 10512 Glenmary Farm Dr