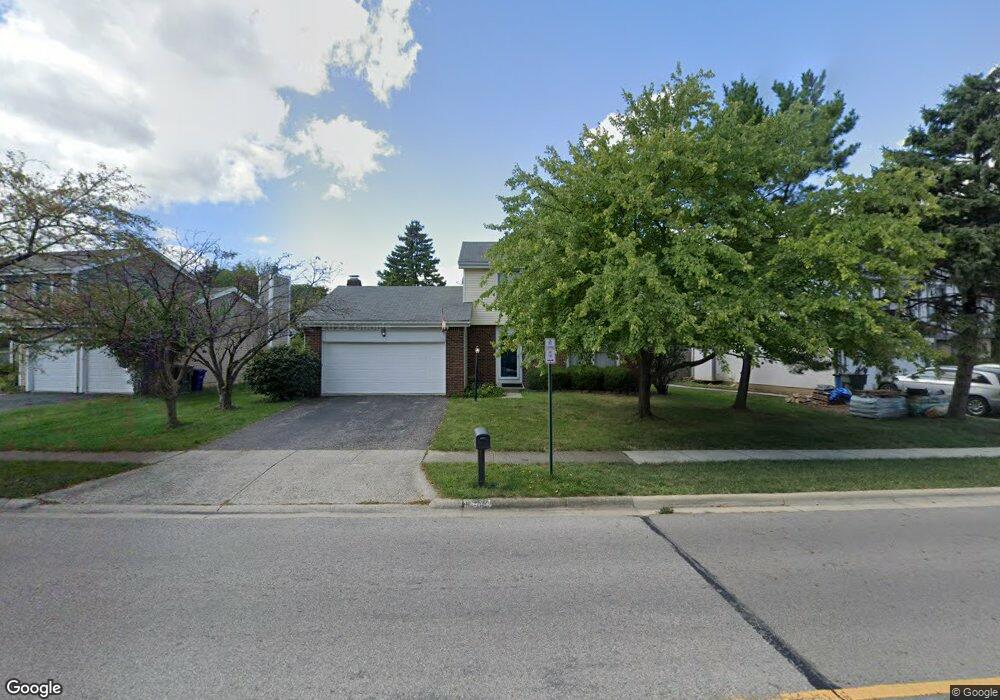
7903 Stanburn Rd Columbus, OH 43235
Foxboro NeighborhoodEstimated Value: $391,000 - $417,000
3
Beds
3
Baths
1,960
Sq Ft
$205/Sq Ft
Est. Value
About This Home
This home is located at 7903 Stanburn Rd, Columbus, OH 43235 and is currently estimated at $402,086, approximately $205 per square foot. 7903 Stanburn Rd is a home located in Franklin County with nearby schools including Albert Chapman Elementary School, Ann Simpson Davis Middle School, and Dublin Scioto High School.
Ownership History
Date
Name
Owned For
Owner Type
Purchase Details
Closed on
Dec 8, 2011
Sold by
Choudhary Satish and Choudhary Neena
Bought by
Keough Lawrence D and Keough Jaclyn A
Current Estimated Value
Home Financials for this Owner
Home Financials are based on the most recent Mortgage that was taken out on this home.
Original Mortgage
$147,157
Outstanding Balance
$101,195
Interest Rate
4.12%
Mortgage Type
FHA
Estimated Equity
$300,891
Purchase Details
Closed on
May 28, 2003
Sold by
Handler Neal L and Handler Maureen J
Bought by
Choudhary Satish and Choudhary Neena
Home Financials for this Owner
Home Financials are based on the most recent Mortgage that was taken out on this home.
Original Mortgage
$120,400
Interest Rate
5.78%
Mortgage Type
Balloon
Purchase Details
Closed on
Nov 14, 1984
Bought by
Handler Neal L
Purchase Details
Closed on
Sep 1, 1984
Create a Home Valuation Report for This Property
The Home Valuation Report is an in-depth analysis detailing your home's value as well as a comparison with similar homes in the area
Home Values in the Area
Average Home Value in this Area
Purchase History
| Date | Buyer | Sale Price | Title Company |
|---|---|---|---|
| Keough Lawrence D | $151,000 | Attorney | |
| Choudhary Satish | $150,500 | Chicago Title | |
| Handler Neal L | $86,000 | -- | |
| -- | -- | -- |
Source: Public Records
Mortgage History
| Date | Status | Borrower | Loan Amount |
|---|---|---|---|
| Open | Keough Lawrence D | $147,157 | |
| Previous Owner | Choudhary Satish | $120,400 |
Source: Public Records
Tax History Compared to Growth
Tax History
| Year | Tax Paid | Tax Assessment Tax Assessment Total Assessment is a certain percentage of the fair market value that is determined by local assessors to be the total taxable value of land and additions on the property. | Land | Improvement |
|---|---|---|---|---|
| 2024 | $6,023 | $99,580 | $34,270 | $65,310 |
| 2023 | $5,938 | $99,575 | $34,265 | $65,310 |
| 2022 | $4,831 | $75,290 | $18,870 | $56,420 |
| 2021 | $4,909 | $75,290 | $18,870 | $56,420 |
| 2020 | $4,880 | $75,290 | $18,870 | $56,420 |
| 2019 | $4,446 | $60,730 | $15,720 | $45,010 |
| 2018 | $4,228 | $60,730 | $15,720 | $45,010 |
| 2017 | $4,036 | $60,730 | $15,720 | $45,010 |
| 2016 | $3,967 | $55,130 | $15,020 | $40,110 |
| 2015 | $3,992 | $55,130 | $15,020 | $40,110 |
| 2014 | $3,996 | $55,130 | $15,020 | $40,110 |
| 2013 | $2,028 | $55,125 | $15,015 | $40,110 |
Source: Public Records
Map
Nearby Homes
- 2488 Dunstan Dr
- 2469 Sandstrom Dr
- 2456 Sanford Dr
- 2462 Sanford Dr
- 2423 Sutter Pkwy
- 2392 Dunsworth Dr
- 2220 Surreygate Dr
- 2620 Cedar Lake Dr Unit 2620
- 7871 Thornfield Ln
- 7917 Meadowhaven Blvd Unit 11
- 2475 Slateshire Dr
- 2074 Hard Rd
- 7607-7609 Penwood Place
- 1996 Starbridge Ct
- 3915 Inverness Cir Unit 3915
- 2161 Heatherfield Ave
- 7373 Palmleaf Ln
- 7774 Essex Gate Dr S Unit 7774
- 8108 Smoky Row Rd
- 1889 Slaton Ct Unit 1889
- 7895 Stanburn Rd
- 7911 Stanburn Rd
- 7911 Stanburn Rd Unit O
- 2466 Dunstan Dr
- 2421 Hard Rd
- 7887 Stanburn Rd
- 2447 Hard Rd
- 2459 Hard Rd
- 7884 Stanburn Rd
- 2472 Dunstan Dr
- 7900 Stanburn Rd
- 7892 Stanburn Rd
- 7908 Stanburn Rd
- 2438 Bradenton Ct
- 2430 Bradenton Ct
- 2477 Hard Rd
- 2414 Bradenton Ct
- 2432 Bradenton Ct
- 2406 Bradenton Ct
- 7921 Stanburn Rd