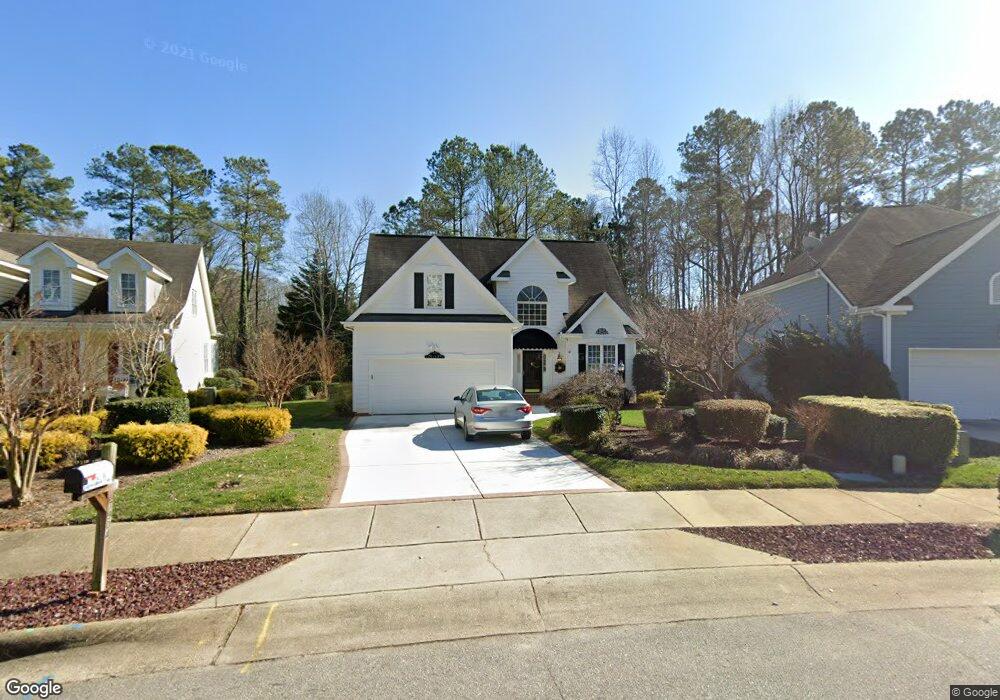
7904 Mill Trace Run Raleigh, NC 27615
Estimated Value: $449,577 - $473,000
--
Bed
3
Baths
1,776
Sq Ft
$260/Sq Ft
Est. Value
About This Home
This home is located at 7904 Mill Trace Run, Raleigh, NC 27615 and is currently estimated at $462,644, approximately $260 per square foot. 7904 Mill Trace Run is a home located in Wake County with nearby schools including North Ridge Elementary School, West Millbrook Middle School, and Millbrook High School.
Ownership History
Date
Name
Owned For
Owner Type
Purchase Details
Closed on
Apr 30, 2009
Sold by
Duchene Leon J
Bought by
Collier Harold and Collier Linda
Current Estimated Value
Home Financials for this Owner
Home Financials are based on the most recent Mortgage that was taken out on this home.
Original Mortgage
$122,400
Outstanding Balance
$77,999
Interest Rate
5.01%
Mortgage Type
Purchase Money Mortgage
Estimated Equity
$384,645
Purchase Details
Closed on
Jun 30, 2003
Sold by
Kirkland Katherine and Graham Greg
Bought by
Duchene Leon J
Home Financials for this Owner
Home Financials are based on the most recent Mortgage that was taken out on this home.
Original Mortgage
$140,000
Interest Rate
4%
Mortgage Type
Purchase Money Mortgage
Purchase Details
Closed on
Nov 5, 1999
Sold by
Gibraltar Properties Development Llc
Bought by
Kirkland Katherine M
Home Financials for this Owner
Home Financials are based on the most recent Mortgage that was taken out on this home.
Original Mortgage
$50,000
Interest Rate
7.35%
Create a Home Valuation Report for This Property
The Home Valuation Report is an in-depth analysis detailing your home's value as well as a comparison with similar homes in the area
Home Values in the Area
Average Home Value in this Area
Purchase History
| Date | Buyer | Sale Price | Title Company |
|---|---|---|---|
| Collier Harold | $236,000 | None Available | |
| Duchene Leon J | $202,000 | -- | |
| Kirkland Katherine M | $178,000 | -- |
Source: Public Records
Mortgage History
| Date | Status | Borrower | Loan Amount |
|---|---|---|---|
| Open | Collier Harold | $122,400 | |
| Previous Owner | Duchene Leon J | $140,000 | |
| Previous Owner | Kirkland Katherine M | $50,000 |
Source: Public Records
Tax History Compared to Growth
Tax History
| Year | Tax Paid | Tax Assessment Tax Assessment Total Assessment is a certain percentage of the fair market value that is determined by local assessors to be the total taxable value of land and additions on the property. | Land | Improvement |
|---|---|---|---|---|
| 2025 | $3,718 | $424,082 | $145,000 | $279,082 |
| 2024 | $3,703 | $424,082 | $145,000 | $279,082 |
| 2023 | $3,209 | $292,546 | $66,500 | $226,046 |
| 2022 | $2,982 | $292,546 | $66,500 | $226,046 |
| 2021 | $2,866 | $292,546 | $66,500 | $226,046 |
| 2020 | $2,814 | $292,546 | $66,500 | $226,046 |
| 2019 | $2,734 | $234,173 | $59,850 | $174,323 |
| 2018 | $2,579 | $234,173 | $59,850 | $174,323 |
| 2017 | $2,456 | $234,173 | $59,850 | $174,323 |
| 2016 | $0 | $234,173 | $59,850 | $174,323 |
| 2015 | -- | $222,746 | $56,000 | $166,746 |
| 2014 | -- | $222,746 | $56,000 | $166,746 |
Source: Public Records
Map
Nearby Homes
- 2509 Goudy Dr
- 8800 Harps Mill Rd
- 8621 Swarthmore Dr
- 2709 Iman Dr
- 8516 Wheeling Dr
- 2216 Gresham Lake Rd
- 2516 Constitution Dr
- 2505 Coxindale Dr
- 2353 Florida Ct
- 2301 Declaration Dr
- 8324 Bellingham Cir
- 2328 Florida Ct
- 7620 Rainwater Rd
- 7316 Massachusetts Ct
- 2317 Declaration Dr
- 2105 Prescott Place
- 8700 Den Ct
- 7404 Rainwater Rd
- 7516 Wingfoot Dr
- 8804 Colesbury Dr
- 7908 Milltrace Run
- 7900 Mill Trace Run
- 7908 Mill Trace Run
- 7900 Milltrace Run
- 7912 Mill Trace Run
- 7912 Milltrace Run
- 7808 Mill Trace Run
- 8729 Paddle Wheel Dr
- 8211 Gresham Trace Ln
- 7916 Milltrace Run
- 7804 Mill Trace Run
- 7916 Mill Trace Run
- 0 Milltrace Run
- 8215 Gresham Trace Ln
- 7917 Mill Trace Run
- 7917 Milltrace Run
- 7917R Milltrace Run
- 8711 Harps Mill Rd
- 8732 Paddle Wheel Dr
- 7920 Mill Trace Run