Estimated Value: $316,979 - $360,000
2
Beds
2
Baths
1,256
Sq Ft
$273/Sq Ft
Est. Value
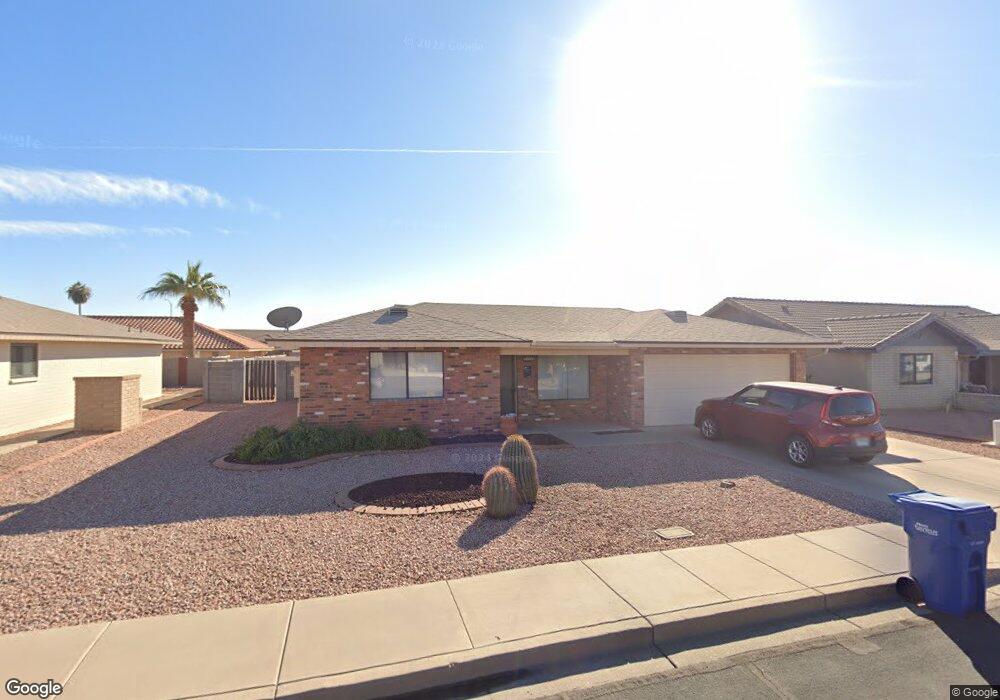
About This Home
This home is located at 7905 E Mendoza Ave, Mesa, AZ 85209 and is currently estimated at $342,995, approximately $273 per square foot. 7905 E Mendoza Ave is a home located in Maricopa County with nearby schools including Boulder Creek Elementary School, Desert Ridge Jr. High School, and Desert Ridge High School.
Ownership History
Date
Name
Owned For
Owner Type
Purchase Details
Closed on
Dec 29, 2006
Sold by
Rossoll Cheryl A and The D & A Craw Family Trust
Bought by
Tarbell Jay A and Clark Rebecca A
Current Estimated Value
Home Financials for this Owner
Home Financials are based on the most recent Mortgage that was taken out on this home.
Original Mortgage
$152,000
Outstanding Balance
$90,278
Interest Rate
6.1%
Mortgage Type
New Conventional
Estimated Equity
$252,717
Purchase Details
Closed on
May 3, 2005
Sold by
Craw Donald L
Bought by
Craw Donald L and The D & A Craw Family Trust
Purchase Details
Closed on
Jul 6, 2004
Sold by
Nowak Henry A and Nowak Mary M
Bought by
Craw Donald L and Craw Annie C
Home Financials for this Owner
Home Financials are based on the most recent Mortgage that was taken out on this home.
Original Mortgage
$43,000
Interest Rate
6.27%
Mortgage Type
New Conventional
Purchase Details
Closed on
Jun 6, 1994
Sold by
Nowak Henry A and Nowak Mary M
Bought by
Nowak Henry A and Nowak Mary M
Create a Home Valuation Report for This Property
The Home Valuation Report is an in-depth analysis detailing your home's value as well as a comparison with similar homes in the area
Purchase History
| Date | Buyer | Sale Price | Title Company |
|---|---|---|---|
| Tarbell Jay A | $190,000 | Title Guaranty Agency | |
| Craw Donald L | -- | -- | |
| Craw Donald L | $143,000 | Security Title Agency | |
| Nowak Henry A | -- | -- |
Source: Public Records
Mortgage History
| Date | Status | Borrower | Loan Amount |
|---|---|---|---|
| Open | Tarbell Jay A | $152,000 | |
| Previous Owner | Craw Donald L | $43,000 | |
| Closed | Craw Donald L | $50,000 |
Source: Public Records
Tax History
| Year | Tax Paid | Tax Assessment Tax Assessment Total Assessment is a certain percentage of the fair market value that is determined by local assessors to be the total taxable value of land and additions on the property. | Land | Improvement |
|---|---|---|---|---|
| 2025 | $1,530 | $20,661 | -- | -- |
| 2024 | $1,485 | $19,677 | -- | -- |
| 2023 | $1,485 | $23,850 | $4,770 | $19,080 |
| 2022 | $1,449 | $20,020 | $4,000 | $16,020 |
| 2021 | $1,569 | $18,230 | $3,640 | $14,590 |
| 2020 | $1,542 | $17,130 | $3,420 | $13,710 |
| 2019 | $1,429 | $15,880 | $3,170 | $12,710 |
| 2018 | $1,360 | $15,070 | $3,010 | $12,060 |
| 2017 | $1,318 | $14,720 | $2,940 | $11,780 |
| 2016 | $1,360 | $13,760 | $2,750 | $11,010 |
| 2015 | $1,253 | $13,310 | $2,660 | $10,650 |
Source: Public Records
Map
Nearby Homes
- 7921 E Madero Ave
- 7937 E Monte Ave
- 8016 E Medina Ave
- 7755 E Laguna Azul Ave Unit 184
- 7866 E Neville Ave
- 2311 S Farnsworth Dr Unit 94
- 2311 S Farnsworth Dr Unit 105
- 2311 S Farnsworth Dr Unit 85
- 7939 E Natal Ave
- 8064 E Madero Ave
- 8061 E Monte Ave
- 8118 E Medina Ave
- 8009 E Natal Ave
- 7838 E Nopal Ave
- 7726 E Neville Ave
- 8021 E Neville Ave
- 8053 E Natal Ave
- 7803 E Kiowa Ave
- 7813 E Nopal Ave
- 7715 E Neville Ave
- 7915 E Mendoza Ave
- 7863 E Mendoza Ave
- 7904 E Meseto Ave
- 7910 E Meseto Ave
- 7862 E Meseto Ave
- 7857 E Mendoza Ave
- 7906 E Mendoza Ave
- 7919 E Mendoza Ave
- 7866 E Mendoza Ave
- 7864 E Mendoza Ave
- 7856 E Meseto Ave
- 7918 E Meseto Ave
- 7858 E Mendoza Ave
- 7920 E Mendoza Ave
- 7851 E Mendoza Ave
- 7927 E Mendoza Ave
- 7905 E Madero Ave
- 7850 E Meseto Ave
- 7926 E Meseto Ave
- 7924 E Meseto Ave
Your Personal Tour Guide
Ask me questions while you tour the home.