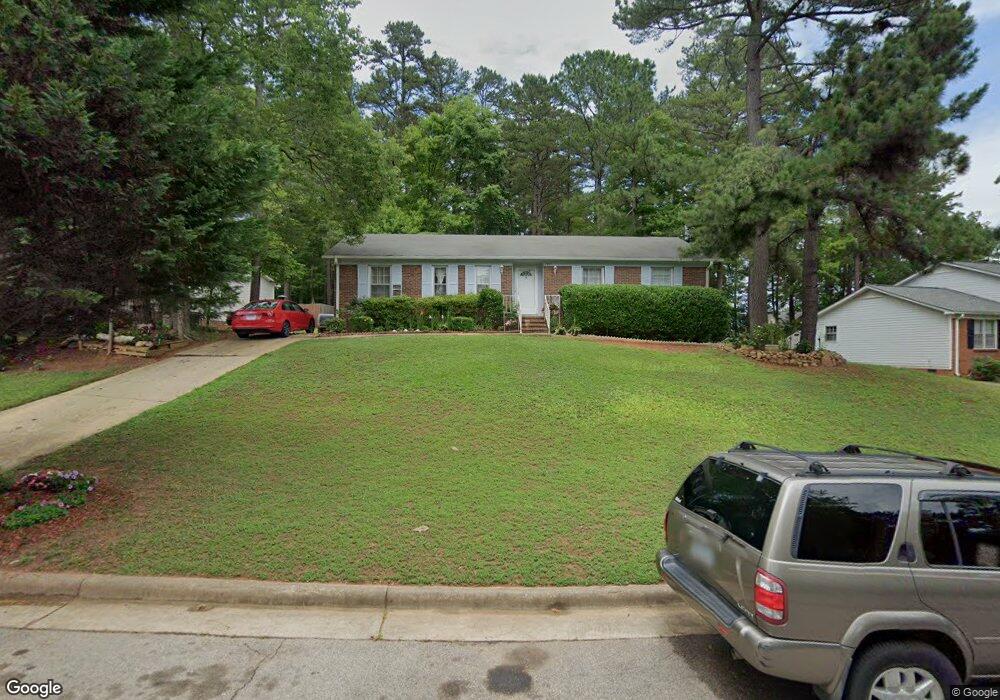
7905 Nugget Ln Raleigh, NC 27615
Estimated Value: $404,000 - $425,000
3
Beds
2
Baths
1,480
Sq Ft
$282/Sq Ft
Est. Value
About This Home
This home is located at 7905 Nugget Ln, Raleigh, NC 27615 and is currently estimated at $418,069, approximately $282 per square foot. 7905 Nugget Ln is a home located in Wake County with nearby schools including Lead Mine Elementary School, West Millbrook Middle School, and Sanderson High School.
Ownership History
Date
Name
Owned For
Owner Type
Purchase Details
Closed on
May 5, 2020
Sold by
Hall Ewa
Bought by
Hall Ewa and Hall Lawrence H
Current Estimated Value
Purchase Details
Closed on
Mar 20, 2020
Sold by
Flores Juan C and Flores Lidia
Bought by
Hall Ewa
Purchase Details
Closed on
Dec 15, 2004
Sold by
Flores Ricardo A and Flores Olivia
Bought by
Flores Juan C and Flores Lidia
Home Financials for this Owner
Home Financials are based on the most recent Mortgage that was taken out on this home.
Original Mortgage
$128,807
Interest Rate
5.67%
Mortgage Type
Purchase Money Mortgage
Purchase Details
Closed on
Apr 30, 2002
Sold by
Halleran Thomas J and Halleran Agnes C
Bought by
Flores Juan C and Flores Lidia
Home Financials for this Owner
Home Financials are based on the most recent Mortgage that was taken out on this home.
Original Mortgage
$131,957
Interest Rate
7.07%
Mortgage Type
FHA
Create a Home Valuation Report for This Property
The Home Valuation Report is an in-depth analysis detailing your home's value as well as a comparison with similar homes in the area
Home Values in the Area
Average Home Value in this Area
Purchase History
| Date | Buyer | Sale Price | Title Company |
|---|---|---|---|
| Hall Ewa | -- | None Available | |
| Hall Ewa | $23,800 | Magnolia Title Company Llc | |
| Hall Ewa | $238,000 | None Listed On Document | |
| Flores Juan C | -- | -- | |
| Flores Juan C | $133,000 | -- |
Source: Public Records
Mortgage History
| Date | Status | Borrower | Loan Amount |
|---|---|---|---|
| Previous Owner | Flores Juan C | $128,807 | |
| Previous Owner | Flores Juan C | $131,957 |
Source: Public Records
Tax History Compared to Growth
Tax History
| Year | Tax Paid | Tax Assessment Tax Assessment Total Assessment is a certain percentage of the fair market value that is determined by local assessors to be the total taxable value of land and additions on the property. | Land | Improvement |
|---|---|---|---|---|
| 2025 | $3,300 | $376,141 | $175,000 | $201,141 |
| 2024 | $3,287 | $376,141 | $175,000 | $201,141 |
| 2023 | $2,844 | $259,097 | $107,000 | $152,097 |
| 2022 | $2,643 | $259,097 | $107,000 | $152,097 |
| 2021 | $2,541 | $259,097 | $107,000 | $152,097 |
| 2020 | $2,495 | $259,097 | $107,000 | $152,097 |
| 2019 | $1,998 | $170,680 | $56,000 | $114,680 |
| 2018 | $1,885 | $170,680 | $56,000 | $114,680 |
| 2017 | $1,796 | $170,680 | $56,000 | $114,680 |
| 2016 | $1,759 | $170,680 | $56,000 | $114,680 |
| 2015 | $1,778 | $169,817 | $56,000 | $113,817 |
| 2014 | -- | $169,817 | $56,000 | $113,817 |
Source: Public Records
Map
Nearby Homes
- 721 Tan Tara Square
- 7804 Brandyapple Dr
- 8015 Brown Bark Place
- 8004 Thrush Ridge Ln
- 8011 Allyns Landing Way Unit 302
- 8011 Allyns Landing Way Unit 202
- 8021 Thrush Ridge Ln
- 42 Renwick Ct
- 8124 Upper Lake Dr
- 206 Nouveau Ave
- 7340 Doverton Ct
- 302 Bon Marche Ln
- 7731 Kingsberry Ct
- 7715 Kingsberry Ct
- 1104 Theresa Ct
- 7412 Post Oak Rd
- 1005 Woodhill Ct
- 8231 Allyns Landing Way Unit 101
- 7216 Bluffside Ct
- 7177 Sandy Creek Dr Unit D6
- 7901 Nugget Ln
- 7909 Nugget Ln
- 7813 Nugget Ln
- 7801 Foxwood Dr
- 7900 Nugget Ln
- 7805 Foxwood Dr
- 7904 Nugget Ln
- 7913 Twin Oak Ct
- 7809 Nugget Ln
- 7908 Nugget Ln
- 7809 Foxwood Dr
- 707 Tan Tara Square
- 711 Tan Tara Square
- 7804 Nugget Ln
- 713 Tan Tara Square
- 705 Tan Tara Square
- 733 Tan Tara Square
- 7909 Twin Oaks
- 7909 Twin Oak Ct
- 7904 Twin Oak Ct