7905 Treeside Ct Springfield, VA 22152
Estimated Value: $517,000 - $624,000
3
Beds
3
Baths
1,408
Sq Ft
$413/Sq Ft
Est. Value
About This Home
This home is located at 7905 Treeside Ct, Springfield, VA 22152 and is currently estimated at $581,884, approximately $413 per square foot. 7905 Treeside Ct is a home located in Fairfax County with nearby schools including West Springfield Elementary School, Irving Middle School, and West Springfield High School.
Ownership History
Date
Name
Owned For
Owner Type
Purchase Details
Closed on
Jun 3, 2022
Sold by
Lonergan Kevin M
Bought by
Lonergan Jeffrey N and Lonergan Meghan C
Current Estimated Value
Purchase Details
Closed on
May 30, 2006
Sold by
Bowler Ellis W
Bought by
Lonergan Jeffrey N and Lonergan,Kevin M
Home Financials for this Owner
Home Financials are based on the most recent Mortgage that was taken out on this home.
Original Mortgage
$323,200
Interest Rate
6.55%
Mortgage Type
New Conventional
Purchase Details
Closed on
Jun 30, 2004
Sold by
Ingram Richard C
Bought by
Bowler Ellis W
Home Financials for this Owner
Home Financials are based on the most recent Mortgage that was taken out on this home.
Original Mortgage
$310,000
Interest Rate
6.3%
Mortgage Type
New Conventional
Create a Home Valuation Report for This Property
The Home Valuation Report is an in-depth analysis detailing your home's value as well as a comparison with similar homes in the area
Home Values in the Area
Average Home Value in this Area
Purchase History
| Date | Buyer | Sale Price | Title Company |
|---|---|---|---|
| Lonergan Jeffrey N | -- | None Listed On Document | |
| Lonergan Jeffrey N | $404,000 | -- | |
| Bowler Ellis W | $310,000 | -- |
Source: Public Records
Mortgage History
| Date | Status | Borrower | Loan Amount |
|---|---|---|---|
| Previous Owner | Lonergan Jeffrey N | $323,200 | |
| Previous Owner | Bowler Ellis W | $310,000 |
Source: Public Records
Tax History
| Year | Tax Paid | Tax Assessment Tax Assessment Total Assessment is a certain percentage of the fair market value that is determined by local assessors to be the total taxable value of land and additions on the property. | Land | Improvement |
|---|---|---|---|---|
| 2025 | $5,603 | $558,690 | $180,000 | $378,690 |
| 2024 | $5,603 | $483,620 | $155,000 | $328,620 |
| 2023 | $5,465 | $484,300 | $155,000 | $329,300 |
| 2022 | $5,249 | $459,020 | $135,000 | $324,020 |
| 2021 | $5,177 | $441,130 | $120,000 | $321,130 |
| 2020 | $5,015 | $423,770 | $105,000 | $318,770 |
| 2019 | $4,592 | $388,000 | $100,000 | $288,000 |
| 2018 | $4,317 | $375,350 | $100,000 | $275,350 |
| 2017 | $4,294 | $369,820 | $100,000 | $269,820 |
| 2016 | $3,973 | $342,950 | $95,000 | $247,950 |
Source: Public Records
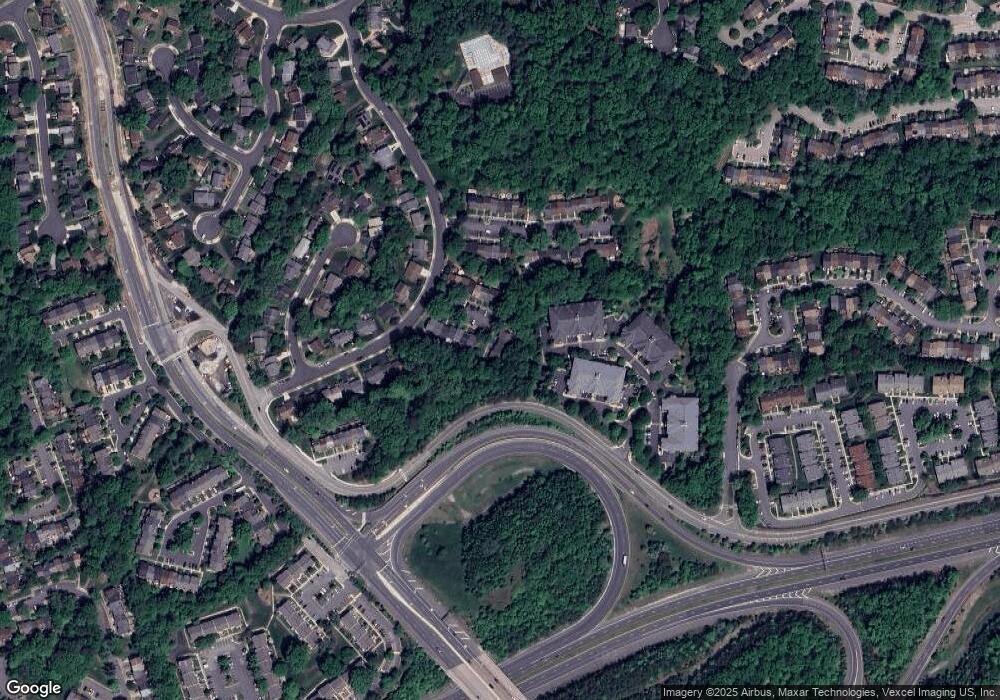
Map
Nearby Homes
- 7871 Rolling Woods Ct Unit 1104
- 7239 Jillspring Ct Unit 17C
- 7812 Solomon Seal Dr
- 7808 Solomon Seal Dr
- 7800 Solomon Seal Dr
- 7205 Gentian Ct
- 7200 Duck Ct
- 7312 Spring View Ct
- 7204 Joshua Tree Ln
- 8118 Viola St
- 7820 Rose Garden Ln
- 7937 Bethelen Woods Ln
- 8009 Bethelen Woods Ln
- 7753 Shootingstar Dr
- 6815 Rolling Rd
- 7923 Donegal Ln
- 7504 Mullingar Ct
- 7419 Ridge Oak Ct
- 0 Edge Creek Ln
- 7229 Olde Lantern Way
- 7903 Treeside Ct
- 7907 Treeside Ct
- 7901 Treeside Ct
- 7909 Treeside Ct
- 7911 Treeside Ct
- 7913 Treeside Ct
- 7908 Treeside Ct
- 7915 Treeside Ct
- 7910 Treeside Ct
- 7912 Treeside Ct
- 7914 Treeside Ct
- 7919 Treeside Ct
- 7916 Treeside Ct
- 7918 Treeside Ct
- 7921 Treeside Ct
- 7880 Rolling Woods Ct Unit 101
- 7880 Rolling Woods Ct Unit 202
- 7880 Rolling Woods Ct Unit 35
- 7880 Rolling Woods Ct Unit 19
- 7880 Rolling Woods Ct Unit 404
Your Personal Tour Guide
Ask me questions while you tour the home.