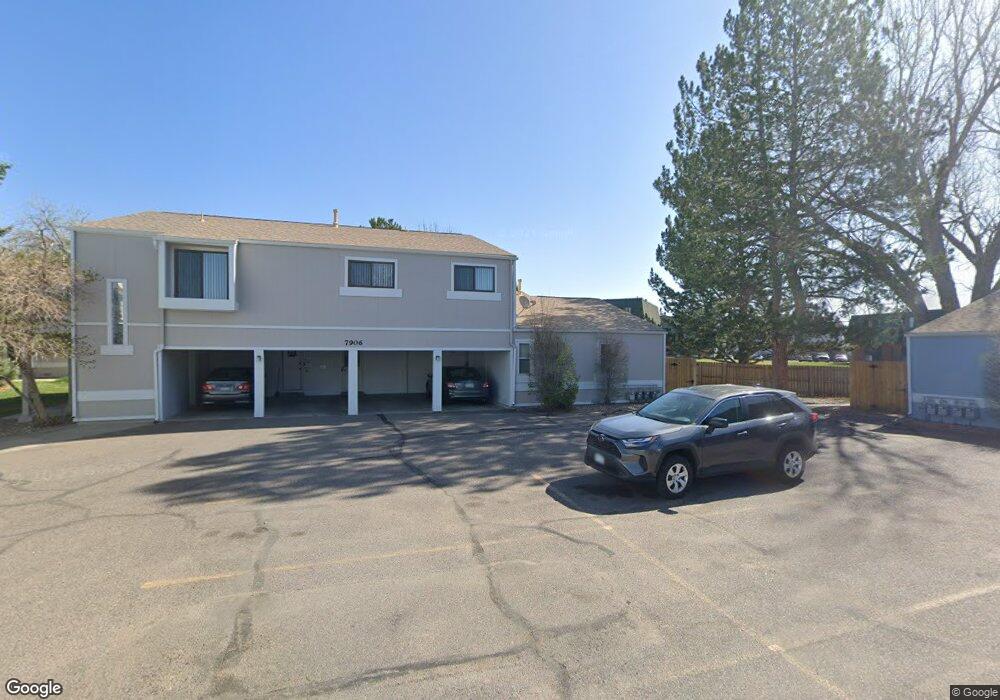
7906 Chase Cir Unit 141 Arvada, CO 80003
Wood Creek NeighborhoodEstimated Value: $270,000 - $294,000
2
Beds
1
Bath
800
Sq Ft
$347/Sq Ft
Est. Value
About This Home
This home is located at 7906 Chase Cir Unit 141, Arvada, CO 80003 and is currently estimated at $277,773, approximately $347 per square foot. 7906 Chase Cir Unit 141 is a home located in Jefferson County with nearby schools including Swanson Elementary School, North Arvada Middle School, and Arvada High School.
Ownership History
Date
Name
Owned For
Owner Type
Purchase Details
Closed on
Oct 27, 2015
Sold by
The Buy Out Company Lllp
Bought by
Vangundy Patricia and Van Gundy Dustin J
Current Estimated Value
Purchase Details
Closed on
May 29, 2015
Sold by
Doman Mary M
Bought by
The Buy Out Company Lllp
Purchase Details
Closed on
May 6, 2015
Sold by
Doman Mary M
Bought by
The Buy Out Company Lllp
Purchase Details
Closed on
Feb 23, 1994
Sold by
Tovar Mark R
Bought by
Doman Mary M
Home Financials for this Owner
Home Financials are based on the most recent Mortgage that was taken out on this home.
Original Mortgage
$48,100
Interest Rate
7%
Mortgage Type
FHA
Create a Home Valuation Report for This Property
The Home Valuation Report is an in-depth analysis detailing your home's value as well as a comparison with similar homes in the area
Home Values in the Area
Average Home Value in this Area
Purchase History
| Date | Buyer | Sale Price | Title Company |
|---|---|---|---|
| Vangundy Patricia | $130,000 | None Available | |
| The Buy Out Company Lllp | -- | None Available | |
| The Buy Out Company Lllp | $115,447 | None Available | |
| Doman Mary M | $49,000 | -- |
Source: Public Records
Mortgage History
| Date | Status | Borrower | Loan Amount |
|---|---|---|---|
| Previous Owner | Doman Mary M | $48,100 |
Source: Public Records
Tax History
| Year | Tax Paid | Tax Assessment Tax Assessment Total Assessment is a certain percentage of the fair market value that is determined by local assessors to be the total taxable value of land and additions on the property. | Land | Improvement |
|---|---|---|---|---|
| 2024 | $1,576 | $16,244 | $6,030 | $10,214 |
| 2023 | $1,576 | $16,244 | $6,030 | $10,214 |
| 2022 | $1,459 | $14,902 | $4,170 | $10,732 |
| 2021 | $1,483 | $15,330 | $4,290 | $11,040 |
| 2020 | $1,382 | $14,323 | $4,290 | $10,033 |
| 2019 | $1,364 | $14,323 | $4,290 | $10,033 |
| 2018 | $1,116 | $11,397 | $3,600 | $7,797 |
| 2017 | $1,022 | $11,397 | $3,600 | $7,797 |
| 2016 | $795 | $8,358 | $2,866 | $5,492 |
| 2015 | $323 | $8,358 | $2,866 | $5,492 |
| 2014 | $323 | $6,376 | $2,229 | $4,147 |
Source: Public Records
Map
Nearby Homes
- 7917 Chase Cir Unit 160
- 7944 Chase Cir Unit 113
- 7953 Chase Cir Unit 200
- 7973 Chase Cir Unit 56
- 7984 Chase Cir Unit 68
- 7977 Chase Cir Unit 47
- 7936 Eaton St
- 7994 Chase Cir Unit 20
- 7996 Chase Cir Unit 5
- 7978 Chase Cir Unit B
- 7980 Chase Cir Unit F
- 7680 Depew St Unit 1424
- 5565 W 76th Ave Unit 1204
- 5620 W 80th Place Unit 55
- 5620 W 80th Place Unit 66
- 5690 W 80th Place Unit 98
- 5690 W 80th Place Unit 91
- 5321 W 76th Ave Unit 322
- 5341 W 76th Ave Unit 213
- 8126 Benton Way
- 7906 Chase Cir Unit 144
- 7906 Chase Cir Unit 143
- 7906 Chase Cir Unit 142
- 7906 Chase Cir Unit 36144
- 7908 Chase Cir Unit 140
- 7908 Chase Cir Unit 139
- 7908 Chase Cir Unit 138
- 7908 Chase Cir Unit 137
- 7904 Chase Cir Unit 148
- 7904 Chase Cir Unit 145
- 7904 Chase Cir
- 7924 Chase Cir Unit 132
- 7924 Chase Cir Unit 131
- 7924 Chase Cir Unit 130
- 7924 Chase Cir Unit 129
- 7902 Chase Cir Unit 151
- 7902 Chase Cir Unit 150
- 7902 Chase Cir Unit 149
- 7922 Chase Cir Unit 136
- 7922 Chase Cir Unit 135
Your Personal Tour Guide
Ask me questions while you tour the home.