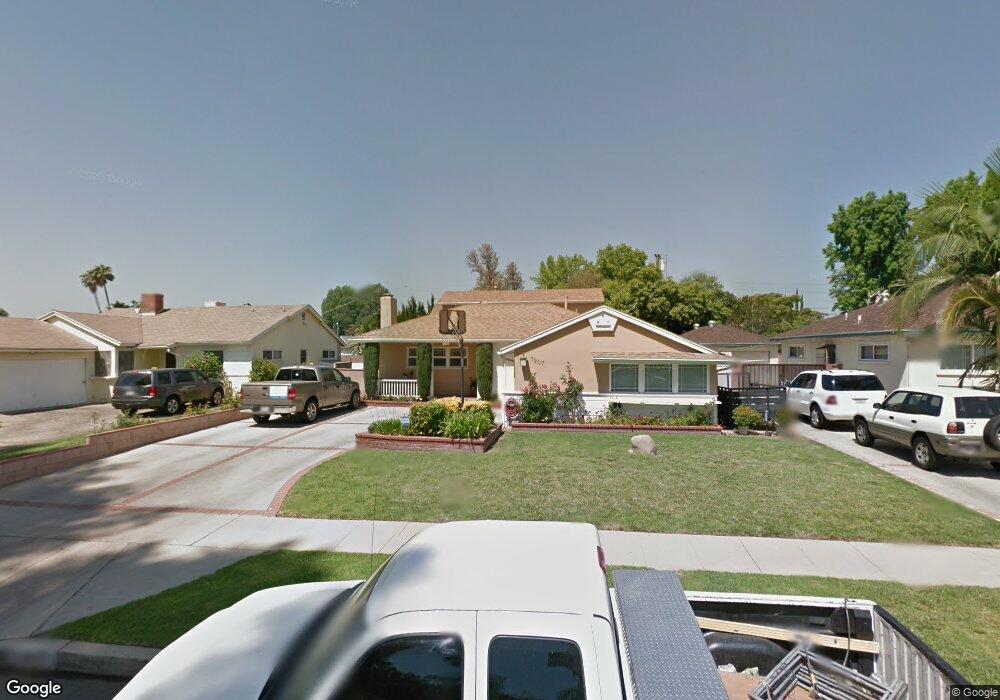
7907 Limerick Ave Winnetka, CA 91306
Estimated Value: $883,802 - $1,000,000
4
Beds
3
Baths
2,294
Sq Ft
$402/Sq Ft
Est. Value
About This Home
This home is located at 7907 Limerick Ave, Winnetka, CA 91306 and is currently estimated at $922,451, approximately $402 per square foot. 7907 Limerick Ave is a home located in Los Angeles County with nearby schools including Sunny Brae Avenue Elementary School, John A. Sutter Middle School, and Canoga Park Senior High School.
Ownership History
Date
Name
Owned For
Owner Type
Purchase Details
Closed on
Sep 13, 2002
Sold by
Leuterio Vicente
Bought by
Leuterio Vicente and Martinez Leuterio Jannette
Current Estimated Value
Home Financials for this Owner
Home Financials are based on the most recent Mortgage that was taken out on this home.
Original Mortgage
$170,000
Outstanding Balance
$71,015
Interest Rate
6.24%
Estimated Equity
$851,436
Purchase Details
Closed on
Jan 21, 1999
Sold by
Leuterio Janette
Bought by
Leuterio Vicente
Home Financials for this Owner
Home Financials are based on the most recent Mortgage that was taken out on this home.
Original Mortgage
$151,200
Interest Rate
6.63%
Purchase Details
Closed on
Apr 18, 1997
Sold by
Magy Jeff
Bought by
Leuterio Vicente
Home Financials for this Owner
Home Financials are based on the most recent Mortgage that was taken out on this home.
Original Mortgage
$127,287
Interest Rate
10.5%
Create a Home Valuation Report for This Property
The Home Valuation Report is an in-depth analysis detailing your home's value as well as a comparison with similar homes in the area
Home Values in the Area
Average Home Value in this Area
Purchase History
| Date | Buyer | Sale Price | Title Company |
|---|---|---|---|
| Leuterio Vicente | -- | Financial Title Company | |
| Leuterio Vicente | -- | Fidelity National Title Ins | |
| Leuterio Vicente | $150,000 | Old Republic Title Company |
Source: Public Records
Mortgage History
| Date | Status | Borrower | Loan Amount |
|---|---|---|---|
| Open | Leuterio Vicente | $170,000 | |
| Closed | Leuterio Vicente | $151,200 | |
| Closed | Leuterio Vicente | $127,287 |
Source: Public Records
Tax History
| Year | Tax Paid | Tax Assessment Tax Assessment Total Assessment is a certain percentage of the fair market value that is determined by local assessors to be the total taxable value of land and additions on the property. | Land | Improvement |
|---|---|---|---|---|
| 2025 | $4,390 | $346,126 | $107,153 | $238,973 |
| 2024 | $4,390 | $339,340 | $105,052 | $234,288 |
| 2023 | $4,309 | $332,688 | $102,993 | $229,695 |
| 2022 | $4,116 | $326,166 | $100,974 | $225,192 |
| 2021 | $4,054 | $319,772 | $98,995 | $220,777 |
| 2019 | $3,936 | $310,289 | $96,059 | $214,230 |
| 2018 | $3,785 | $304,206 | $94,176 | $210,030 |
| 2016 | $3,593 | $292,395 | $90,520 | $201,875 |
| 2015 | $3,542 | $288,004 | $89,161 | $198,843 |
| 2014 | $3,560 | $282,363 | $87,415 | $194,948 |
Source: Public Records
Map
Nearby Homes
- 7812 Fairchild Ave
- 8021 Mcnulty Ave
- 20456 Strathern St
- 20448 Arminta St
- 20421 Hemmingway St
- 7647 Mason Ave
- 20551 Saticoy St
- 20651 Roscoe Blvd Unit L
- 20318 Blythe St
- 20737 Roscoe Blvd Unit 203
- 20737 Roscoe Blvd Unit 704
- 20329 Stagg St
- 20929 Cantara St
- 21014 Baltar St
- 21045 Blythe St
- 8353 Lurline Ave
- 20819 W Seasons Ln
- 20528 & 20526 Hamlin St
- 20424 Schoenborn St
- 20363 Roscoe Blvd
- 7913 Limerick Ave
- 7901 Limerick Ave
- 7910 Lurline Ave
- 7919 Limerick Ave
- 7866 Mcnulty Ave
- 7860 Mcnulty Ave
- 7916 Lurline Ave
- 7874 Mcnulty Ave
- 7910 Limerick Ave
- 7902 Limerick Ave
- 7916 Limerick Ave
- 7925 Limerick Ave
- 7922 Lurline Ave
- 7920 Limerick Ave
- 7926 Limerick Ave
- 7933 Limerick Ave
- 7901 Lurline Ave
- 7928 Lurline Ave
- 7909 Cozycroft Ave
- 7919 Lurline Ave
Your Personal Tour Guide
Ask me questions while you tour the home.