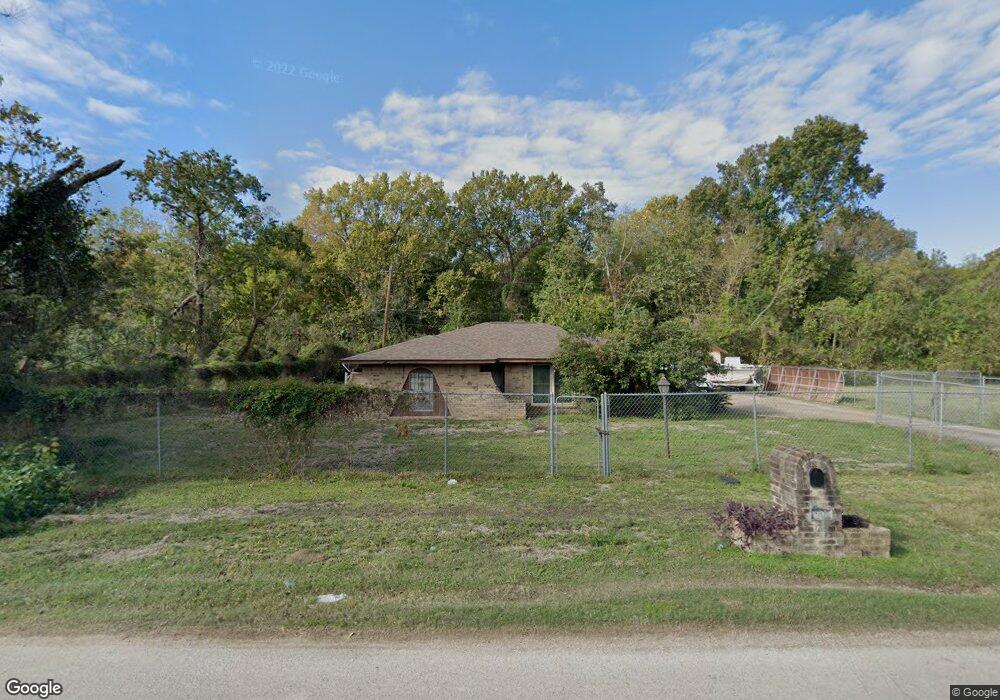
7907 Sunnyhill St Houston, TX 77088
Greater Inwood NeighborhoodEstimated Value: $240,744 - $256,000
3
Beds
2
Baths
1,537
Sq Ft
$162/Sq Ft
Est. Value
About This Home
This home is located at 7907 Sunnyhill St, Houston, TX 77088 and is currently estimated at $248,936, approximately $161 per square foot. 7907 Sunnyhill St is a home located in Harris County with nearby schools including Reece Academy, Anderson Academy, and Houston Academy.
Ownership History
Date
Name
Owned For
Owner Type
Purchase Details
Closed on
May 7, 2004
Sold by
Turner Martha Ozelle
Bought by
Rogers Samuel
Current Estimated Value
Home Financials for this Owner
Home Financials are based on the most recent Mortgage that was taken out on this home.
Original Mortgage
$42,595
Outstanding Balance
$20,013
Interest Rate
5.53%
Mortgage Type
FHA
Estimated Equity
$228,923
Purchase Details
Closed on
Apr 28, 2004
Sold by
Taylor Gene A
Bought by
Turner Martha Ozelle
Home Financials for this Owner
Home Financials are based on the most recent Mortgage that was taken out on this home.
Original Mortgage
$42,595
Outstanding Balance
$20,013
Interest Rate
5.53%
Mortgage Type
FHA
Estimated Equity
$228,923
Purchase Details
Closed on
Feb 1, 1999
Sold by
Palmas Properties Inc
Bought by
Parks Custom Home Builders
Create a Home Valuation Report for This Property
The Home Valuation Report is an in-depth analysis detailing your home's value as well as a comparison with similar homes in the area
Home Values in the Area
Average Home Value in this Area
Purchase History
| Date | Buyer | Sale Price | Title Company |
|---|---|---|---|
| Rogers Samuel | -- | Startex Title Company | |
| Turner Martha Ozelle | -- | Startex Title Company | |
| Turner Martha Ozelle | -- | Startex Title Company | |
| Parks Custom Home Builders | -- | Partners Title Company |
Source: Public Records
Mortgage History
| Date | Status | Borrower | Loan Amount |
|---|---|---|---|
| Open | Rogers Samuel | $42,595 |
Source: Public Records
Tax History Compared to Growth
Tax History
| Year | Tax Paid | Tax Assessment Tax Assessment Total Assessment is a certain percentage of the fair market value that is determined by local assessors to be the total taxable value of land and additions on the property. | Land | Improvement |
|---|---|---|---|---|
| 2025 | -- | $258,761 | $138,051 | $120,710 |
| 2024 | -- | $268,114 | $138,051 | $130,063 |
| 2023 | $2,298 | $240,364 | $138,051 | $102,313 |
| 2022 | $2,280 | $175,478 | $77,000 | $98,478 |
| 2021 | $2,170 | $113,828 | $44,000 | $69,828 |
| 2020 | $2,073 | $94,535 | $27,500 | $67,035 |
| 2019 | $1,976 | $71,410 | $3,300 | $68,110 |
| 2018 | $332 | $69,171 | $3,300 | $65,871 |
| 2017 | $1,835 | $69,171 | $3,300 | $65,871 |
| 2016 | $1,835 | $69,171 | $3,300 | $65,871 |
| 2015 | $697 | $69,171 | $3,300 | $65,871 |
| 2014 | $697 | $69,171 | $3,300 | $65,871 |
Source: Public Records
Map
Nearby Homes
- 7903 Sunnyhill St
- 8101 Venus St Unit A/B
- 8015 Venus St Unit A/B
- 7926 Easter St
- 8010 Easter St
- 3306 Elmcrest Dr
- 3414 Lemon Tree Ln
- 8210 Venus St
- 8303 Venus St
- 8337 Sunnyhill St
- 00 Observatory St
- 5815 Morehouse Ln
- 7726 Ashmole Ln
- 8112 Carver Rd
- 3503 Cherry Forest Dr
- 7413 Easter St
- 3522 Almington Ln
- 2409 Wall St
- 8421 Venus St Unit A B
- 0 Dolly Wright St Unit 24865287
- 7925 Sunnyhill St
- 7912 Zume St
- 7930 Garfield St
- 7935 Sunnyhill St
- 7939 Sunnyhill St
- 7939 Sunnyhill St
- 7912 Sunnyhill St
- 7850 Sunnyhill St
- 8011 Sunnyhill St
- 8219 Venus St
- 8313 Venus St
- 8015 Sunnyhill St
- 2630 Garfield St
- 7823 Sunnyhill St
- 8019 Sunnyhill St
- 2715 Garfield St
- 0 Sunnyhill - Lot 8 Blk 4 St Unit 88340360
- 17-22 Sunnyhill St
- 8403 Sunnyhill St
- LT 18 - 22 BLK 31 Sunnyhill St