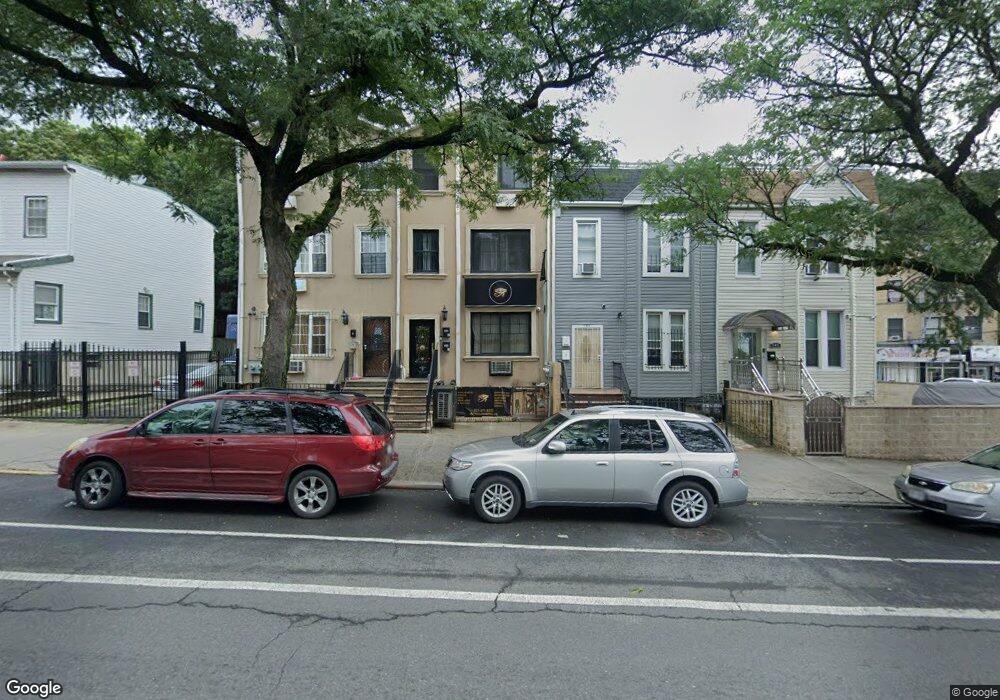
791 E 169th St Bronx, NY 10456
Morrisania NeighborhoodEstimated Value: $856,813 - $976,000
Studio
--
Bath
2,668
Sq Ft
$341/Sq Ft
Est. Value
About This Home
This home is located at 791 E 169th St, Bronx, NY 10456 and is currently estimated at $909,703, approximately $340 per square foot. 791 E 169th St is a home located in Bronx County with nearby schools including P.S. 063 - Author's Academy, I.S. 219 New Venture School @ Charles Drew Educational Campus, and Wildflower New York Charter School.
Ownership History
Date
Name
Owned For
Owner Type
Purchase Details
Closed on
Jun 30, 2014
Sold by
Hakmon Holding Group Inc
Bought by
Willis Patrick
Current Estimated Value
Home Financials for this Owner
Home Financials are based on the most recent Mortgage that was taken out on this home.
Original Mortgage
$431,325
Outstanding Balance
$328,048
Interest Rate
4.12%
Mortgage Type
New Conventional
Estimated Equity
$581,655
Purchase Details
Closed on
Mar 13, 2012
Sold by
United First Equities Llc
Bought by
Hakmon Holding Group Inc
Purchase Details
Closed on
Jan 25, 2012
Sold by
B And D Development Inc
Bought by
United First Equities Llc
Purchase Details
Closed on
Apr 9, 2003
Sold by
Smith Smith
Bought by
795 East 169Th Street Realty Corp
Purchase Details
Closed on
Sep 10, 1996
Sold by
The City Of New York
Bought by
Smith Harold
Create a Home Valuation Report for This Property
The Home Valuation Report is an in-depth analysis detailing your home's value as well as a comparison with similar homes in the area
Home Values in the Area
Average Home Value in this Area
Purchase History
| Date | Buyer | Sale Price | Title Company |
|---|---|---|---|
| Willis Patrick | $439,282 | -- | |
| Hakmon Holding Group Inc | $190,000 | -- | |
| United First Equities Llc | $100,000 | -- | |
| 795 East 169Th Street Realty Corp | $25,000 | -- | |
| Smith Harold | $8,600 | -- |
Source: Public Records
Mortgage History
| Date | Status | Borrower | Loan Amount |
|---|---|---|---|
| Open | Willis Patrick | $431,325 |
Source: Public Records
Tax History
| Year | Tax Paid | Tax Assessment Tax Assessment Total Assessment is a certain percentage of the fair market value that is determined by local assessors to be the total taxable value of land and additions on the property. | Land | Improvement |
|---|---|---|---|---|
| 2025 | $6,668 | $35,191 | $2,819 | $32,372 |
| 2024 | $6,668 | $33,199 | $2,509 | $30,690 |
| 2023 | $6,361 | $31,320 | $2,606 | $28,714 |
| 2022 | $5,952 | $45,600 | $3,600 | $42,000 |
| 2021 | $6,455 | $47,880 | $3,600 | $44,280 |
| 2020 | $6,207 | $41,400 | $3,600 | $37,800 |
| 2019 | $5,787 | $36,600 | $3,600 | $33,000 |
| 2018 | $5,320 | $26,100 | $3,600 | $22,500 |
| 2017 | $5,210 | $25,560 | $3,600 | $21,960 |
| 2016 | $5,230 | $26,160 | $3,600 | $22,560 |
| 2015 | $3,317 | $27,147 | $2,888 | $24,259 |
| 2014 | $3,317 | $27,147 | $2,888 | $24,259 |
Source: Public Records
Map
Nearby Homes
- 757 E 169th St Unit 2A
- 1266 Boston Rd
- 1333 Chisholm St
- 863 Home St
- 661 Jefferson Place
- 1321 Bristow St
- 1384 Clinton Ave
- 1386 Clinton Ave
- 1333 Bristow St
- 1241 Intervale Ave
- 576 E 169th St
- 807 E 170th St
- 1417 Crotona Ave
- 829 Jennings St
- 831 Jennings St
- 815 E 170th St
- 837 Jennings St
- 1137 Tiffany St Unit COMM
- 585 E 167th St
- 1162 Franklin Ave
- 789 E 169th St
- 793 E 169th St
- 787 E 169th St
- 795 E 169th St Unit Building
- 785 E 169th St
- 1273 Union Ave
- 783 E 169th St
- 1279 Union Ave
- 781 E 169th St
- 1281 Union Ave
- 1283 Union Ave
- 776 E 169th St
- 774 E 169th St
- 1278 Union Ave
- 1272 Union Ave
- 1272 Union Ave Unit 204
- 778 E 169th St
- 1282 Union Ave
- 772 E 169th St
Your Personal Tour Guide
Ask me questions while you tour the home.