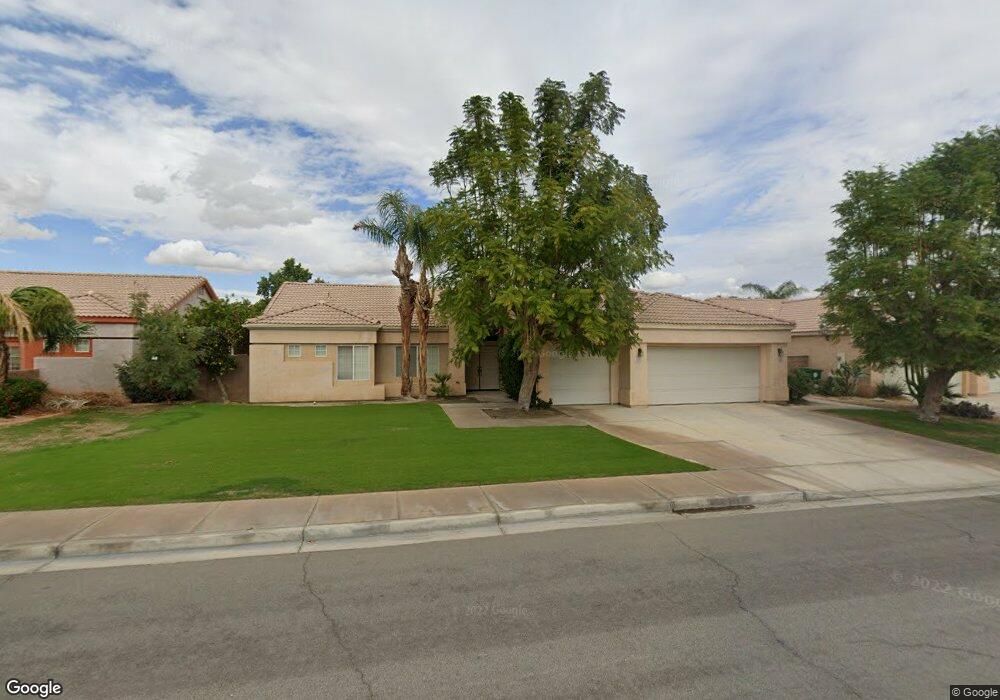
79100 Canterra Dr La Quinta, CA 92253
Estimated Value: $620,000 - $683,000
3
Beds
2
Baths
1,968
Sq Ft
$333/Sq Ft
Est. Value
About This Home
This home is located at 79100 Canterra Dr, La Quinta, CA 92253 and is currently estimated at $655,203, approximately $332 per square foot. 79100 Canterra Dr is a home located in Riverside County with nearby schools including Amelia Earhart Elementary School Of International Studies, John Glenn Middle School Of International Studies, and La Quinta High School.
Ownership History
Date
Name
Owned For
Owner Type
Purchase Details
Closed on
May 24, 2004
Sold by
Kronfly Charles J
Bought by
Kronfly Charles J
Current Estimated Value
Home Financials for this Owner
Home Financials are based on the most recent Mortgage that was taken out on this home.
Original Mortgage
$95,650
Interest Rate
5.99%
Mortgage Type
New Conventional
Purchase Details
Closed on
Jun 28, 2000
Sold by
Kronfly Bud A and Kronfly Milldred J
Bought by
Kronfly Charles J
Home Financials for this Owner
Home Financials are based on the most recent Mortgage that was taken out on this home.
Original Mortgage
$100,000
Interest Rate
7.25%
Purchase Details
Closed on
Aug 2, 1996
Sold by
Ez Okie Inc
Bought by
Kronfly Bud A and Kronfly Milldred J
Home Financials for this Owner
Home Financials are based on the most recent Mortgage that was taken out on this home.
Original Mortgage
$137,475
Interest Rate
8.18%
Create a Home Valuation Report for This Property
The Home Valuation Report is an in-depth analysis detailing your home's value as well as a comparison with similar homes in the area
Home Values in the Area
Average Home Value in this Area
Purchase History
| Date | Buyer | Sale Price | Title Company |
|---|---|---|---|
| Kronfly Charles J | -- | First American Title Co | |
| Kronfly Charles J | $240,000 | First American Title Co | |
| Kronfly Bud A | $172,000 | First American Title Ins Co |
Source: Public Records
Mortgage History
| Date | Status | Borrower | Loan Amount |
|---|---|---|---|
| Closed | Kronfly Charles J | $95,650 | |
| Previous Owner | Kronfly Charles J | $100,000 | |
| Previous Owner | Kronfly Bud A | $137,475 |
Source: Public Records
Tax History Compared to Growth
Tax History
| Year | Tax Paid | Tax Assessment Tax Assessment Total Assessment is a certain percentage of the fair market value that is determined by local assessors to be the total taxable value of land and additions on the property. | Land | Improvement |
|---|---|---|---|---|
| 2025 | $4,558 | $323,940 | $90,394 | $233,546 |
| 2023 | $4,558 | $311,363 | $86,885 | $224,478 |
| 2022 | $4,267 | $305,259 | $85,182 | $220,077 |
| 2021 | $4,157 | $299,274 | $83,512 | $215,762 |
| 2020 | $4,083 | $296,206 | $82,656 | $213,550 |
| 2019 | $4,000 | $290,399 | $81,036 | $209,363 |
| 2018 | $3,913 | $284,706 | $79,448 | $205,258 |
| 2017 | $3,854 | $279,125 | $77,891 | $201,234 |
| 2016 | $3,784 | $273,653 | $76,364 | $197,289 |
| 2015 | $3,794 | $269,545 | $75,218 | $194,327 |
| 2014 | $3,734 | $264,267 | $73,746 | $190,521 |
Source: Public Records
Map
Nearby Homes
- 79185 Canterra Cir
- 79030 Ladera Dr
- 44700 Calle Placido
- 79140 Fred Waring Dr
- 78805 Irwin Cir
- 78755 Villeta Dr
- 44800 Calle Santa Barbara
- 79321 Four Paths Ln
- 78670 Bradford Cir
- 43761 Chapelton Dr
- 79528 Morning Glory Ct
- 44345 Willow Cir
- 79305 Desert Wind Ct
- 79533 Morning Glory Ct
- 43331 Lacovia Dr
- 79150 Buff Bay Ct
- 78640 Alden Cir
- 79541 Morning Glory Ct
- 79624 Morning Glory Ct
- 78860 Zenith Way
- 79110 Canterra Dr
- 79090 Canterra Dr
- 79265 Camino Rosada
- 79235 Camino Rosada
- 79295 Camino Rosada
- 79120 Canterra Dr
- 79080 Canterra Dr
- 44540 Pala Cir
- 79205 Camino Rosada
- 79325 Camino Rosada
- 79115 Canterra Dr
- 44545 Pala Cir
- 79070 Canterra Dr
- 79130 Canterra Dr
- 79175 Camino Rosada
- 79150 Ocotillo Dr
- 79150 Ocotillo Dr Unit ID1022805P
- 79150 Ocotillo Dr
- 79355 Camino Rosada
- 44570 Pala Cir