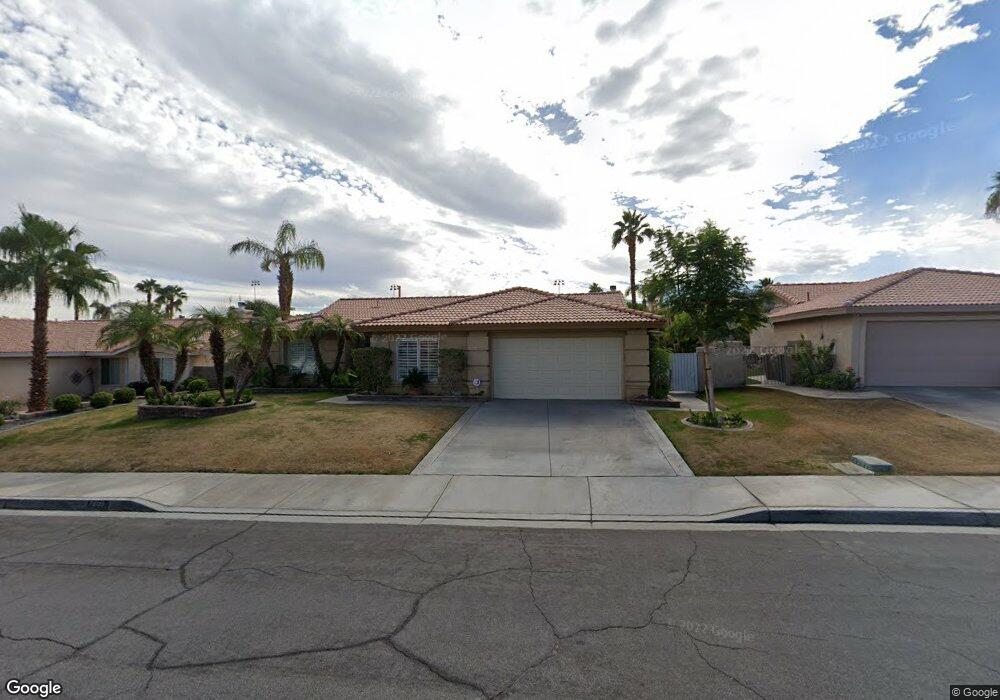
79105 Desert Stream Dr La Quinta, CA 92253
Estimated Value: $457,000 - $613,000
4
Beds
3
Baths
2,003
Sq Ft
$285/Sq Ft
Est. Value
About This Home
This home is located at 79105 Desert Stream Dr, La Quinta, CA 92253 and is currently estimated at $570,844, approximately $284 per square foot. 79105 Desert Stream Dr is a home located in Riverside County with nearby schools including Amelia Earhart Elementary School Of International Studies, John Glenn Middle School Of International Studies, and La Quinta High School.
Ownership History
Date
Name
Owned For
Owner Type
Purchase Details
Closed on
Aug 5, 1999
Sold by
Driscoll Thomas D and Driscoll Bianca M
Bought by
Mcrae Bret and Mcrae Myra
Current Estimated Value
Home Financials for this Owner
Home Financials are based on the most recent Mortgage that was taken out on this home.
Original Mortgage
$150,300
Outstanding Balance
$50,280
Interest Rate
9.75%
Mortgage Type
Purchase Money Mortgage
Estimated Equity
$520,564
Purchase Details
Closed on
Mar 16, 1999
Sold by
Topaz Associates Lp
Bought by
Driscoll Thomas D and Driscoll Bianca M
Home Financials for this Owner
Home Financials are based on the most recent Mortgage that was taken out on this home.
Original Mortgage
$150,110
Interest Rate
6.91%
Mortgage Type
FHA
Create a Home Valuation Report for This Property
The Home Valuation Report is an in-depth analysis detailing your home's value as well as a comparison with similar homes in the area
Home Values in the Area
Average Home Value in this Area
Purchase History
| Date | Buyer | Sale Price | Title Company |
|---|---|---|---|
| Mcrae Bret | $167,000 | First American Title Co | |
| Driscoll Thomas D | $152,500 | First American Title Co |
Source: Public Records
Mortgage History
| Date | Status | Borrower | Loan Amount |
|---|---|---|---|
| Open | Mcrae Bret | $150,300 | |
| Previous Owner | Driscoll Thomas D | $150,110 |
Source: Public Records
Tax History Compared to Growth
Tax History
| Year | Tax Paid | Tax Assessment Tax Assessment Total Assessment is a certain percentage of the fair market value that is determined by local assessors to be the total taxable value of land and additions on the property. | Land | Improvement |
|---|---|---|---|---|
| 2025 | $3,994 | $276,919 | $56,848 | $220,071 |
| 2023 | $3,994 | $266,168 | $54,642 | $211,526 |
| 2022 | $3,724 | $260,950 | $53,571 | $207,379 |
| 2021 | $3,625 | $255,834 | $52,521 | $203,313 |
| 2020 | $3,561 | $253,212 | $51,983 | $201,229 |
| 2019 | $3,489 | $248,248 | $50,964 | $197,284 |
| 2018 | $3,411 | $243,381 | $49,966 | $193,415 |
| 2017 | $3,363 | $238,610 | $48,987 | $189,623 |
| 2016 | $3,305 | $233,932 | $48,027 | $185,905 |
| 2015 | $3,884 | $230,419 | $47,306 | $183,113 |
| 2014 | $3,828 | $225,907 | $46,380 | $179,527 |
Source: Public Records
Map
Nearby Homes
- 79300 Desert Stream Dr
- 79305 Desert Wind Ct
- 79385 Avenida Las Palmas
- 79389 Paseo Del Rey
- 79030 Ladera Dr
- 45703 Crosswater St
- 45905 Crosswater St
- 45623 Green Hills Ct
- 80367 Segovia View Way
- 58132 Aragon Way
- 79573 Carmel Valley Ave
- 45245 Seeley Dr Unit 15G
- 45245 Seeley Dr Unit 17A
- 79185 Canterra Cir
- 78640 Alden Cir
- 78670 Bradford Cir
- 79533 Morning Glory Ct
- 79528 Morning Glory Ct
- 79541 Morning Glory Ct
- 44865 Via Alondra
- 79085 Desert Stream Dr
- 79125 Desert Stream Dr
- 81795 Vida Bella Dr
- 81772 Vida Bella Dr
- 79110 Ashley Place
- 79090 Ashley Place
- 79130 Ashley Place
- 79065 Desert Cove
- 79065 Desert Stream Dr
- 79145 Desert Stream Dr
- 79110 Desert Stream Dr
- 79130 Desert Stream Dr
- 79090 Desert Stream Dr
- 79070 Ashley Place
- 79150 Ashley Place
- 79070 Desert Stream Dr
- 79150 Desert Stream Dr
- 79165 Desert Stream Dr
- 79045 Desert Stream Dr
- 79050 Ashley Place