Estimated Value: $356,671 - $419,000
3
Beds
3
Baths
1,440
Sq Ft
$266/Sq Ft
Est. Value
About This Home
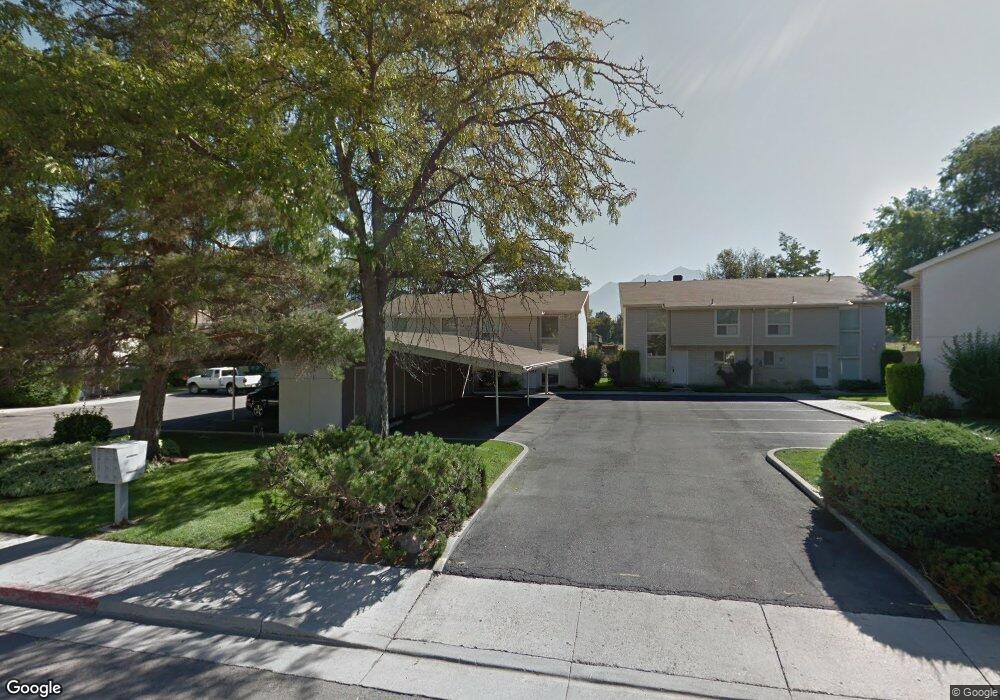
This home is located at 7911 Harvel Dr, Sandy, UT 84070 and is currently estimated at $382,668, approximately $265 per square foot. 7911 Harvel Dr is a home located in Salt Lake County with nearby schools including Midvalley Elementary School, Union Middle School, and Hillcrest High School.
Ownership History
Date
Name
Owned For
Owner Type
Purchase Details
Closed on
Mar 12, 2021
Sold by
Anderson Heidi K
Bought by
South Mountain Enterprises Llc
Current Estimated Value
Purchase Details
Closed on
Apr 17, 2018
Sold by
Anderson Heidi Kyong
Bought by
Anderson Heidi K
Home Financials for this Owner
Home Financials are based on the most recent Mortgage that was taken out on this home.
Original Mortgage
$142,500
Interest Rate
4.46%
Mortgage Type
New Conventional
Purchase Details
Closed on
Oct 25, 2017
Sold by
Na Bong Yon
Bought by
Anderson Heidi Kyong
Purchase Details
Closed on
May 16, 2012
Sold by
Anderson Heidi Kyong
Bought by
Yon Bong
Purchase Details
Closed on
Mar 31, 2008
Sold by
Yon Bong
Bought by
Anderson Heidi Kyong
Purchase Details
Closed on
Oct 30, 2006
Sold by
Jun Byung and Yon Bong Yon
Bought by
Jun Byung and Yon Bong Yon
Create a Home Valuation Report for This Property
The Home Valuation Report is an in-depth analysis detailing your home's value as well as a comparison with similar homes in the area
Home Values in the Area
Average Home Value in this Area
Purchase History
| Date | Buyer | Sale Price | Title Company |
|---|---|---|---|
| South Mountain Enterprises Llc | -- | None Available | |
| Anderson Heidi K | -- | First American Title | |
| Anderson Heidi Kyong | -- | First American Title | |
| Yon Bong | -- | First American Title | |
| Anderson Heidi Kyong | -- | Accommodation | |
| Jun Byung | -- | Accommodation |
Source: Public Records
Mortgage History
| Date | Status | Borrower | Loan Amount |
|---|---|---|---|
| Previous Owner | Anderson Heidi K | $142,500 |
Source: Public Records
Tax History
| Year | Tax Paid | Tax Assessment Tax Assessment Total Assessment is a certain percentage of the fair market value that is determined by local assessors to be the total taxable value of land and additions on the property. | Land | Improvement |
|---|---|---|---|---|
| 2025 | $2,124 | $326,800 | $98,000 | $228,800 |
| 2024 | $2,124 | $348,800 | $104,600 | $244,200 |
| 2023 | $2,118 | $344,500 | $103,300 | $241,200 |
| 2022 | $0 | $335,500 | $100,600 | $234,900 |
| 2021 | $1,897 | $257,800 | $77,300 | $180,500 |
| 2020 | $1,821 | $234,200 | $70,200 | $164,000 |
| 2019 | $1,711 | $214,400 | $64,300 | $150,100 |
| 2016 | $1,208 | $142,700 | $42,800 | $99,900 |
Source: Public Records
Map
Nearby Homes
- 397 E Tractor Dr Unit 103
- 7824 S 280 E
- 7956 S Farm House Ln
- 393 E Corral Creek Dr
- 257 E Water Mill Way
- 350 E 7635 South St
- 257 Water Mill Way Unit 211
- 330 E 7635 S Unit 344
- 354 E 7635 South St
- 274 E Water Mill Way Unit 230
- 7613 S 300 E
- 7359 S Dewmar Ct W Unit 32
- 489 E 7800 S Unit 2
- 7363 S Dewmar Ct W Unit 33
- 7342 S Seven Tree Ln W Unit 77
- 7329 S Seven Tree Ln W Unit 85
- 7371 S Dewmar Ct W Unit 35
- 7327 S Seven Tree Ln W Unit 86
- 7337 S Seven Tree Ln W Unit 82
- 7343 S Seven Tree Ln Unit 79
- 7911 S Harvel Dr
- 7909 Harvel Dr Unit 7909
- 7913 S Harvel Dr
- 7913 Harvel Dr
- 7907 S Harvel Dr
- 7907 Harvel Dr
- 7915 Harvel Dr
- 7902 S Farm House Ln Unit 22
- 7898 S Farm House Ln Unit 21
- 7898 S Farm House Ln
- 7906 S Farm House Ln Unit 23
- 7905 Harvel Dr
- 7894 S Farm House Ln Unit 20
- 7894 S Farm House Ln
- 7919 Harvel Dr
- 7919 S Harvel Dr
- 7917 S Harvel Dr
- 7914 S Farm House Ln Unit 24
- 7901 S Harvel Dr
- 7901 Harvel Dr Unit 7901
Your Personal Tour Guide
Ask me questions while you tour the home.