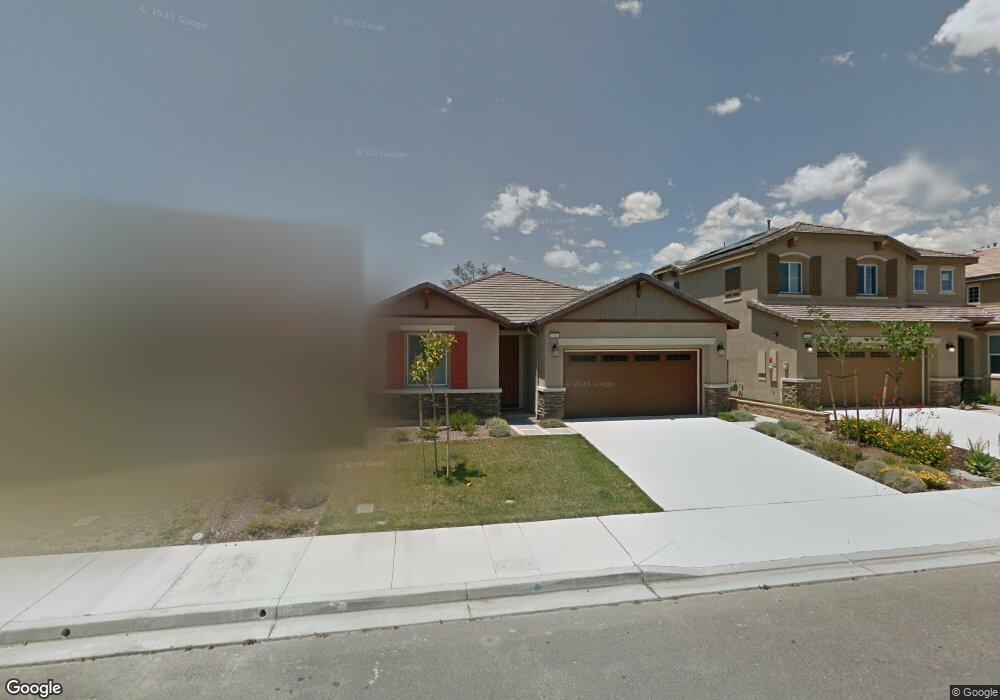
7912 Lemon Pepper Ave Fontana, CA 92336
Estimated Value: $701,111 - $795,000
3
Beds
2
Baths
1,940
Sq Ft
$381/Sq Ft
Est. Value
About This Home
This home is located at 7912 Lemon Pepper Ave, Fontana, CA 92336 and is currently estimated at $739,778, approximately $381 per square foot. 7912 Lemon Pepper Ave is a home with nearby schools including Hemlock Elementary School, Almeria Middle School, and Summit High School.
Ownership History
Date
Name
Owned For
Owner Type
Purchase Details
Closed on
Mar 2, 2021
Sold by
Murphy Dustin P and Murphy Kamri M
Bought by
Murphy Dustin P and Murphy Kamri M
Current Estimated Value
Home Financials for this Owner
Home Financials are based on the most recent Mortgage that was taken out on this home.
Original Mortgage
$350,000
Outstanding Balance
$313,750
Interest Rate
2.7%
Mortgage Type
VA
Estimated Equity
$426,028
Purchase Details
Closed on
Mar 4, 2015
Sold by
Lennar Homes Of California Inc
Bought by
Murphy Dustin and Murphy Kamri
Home Financials for this Owner
Home Financials are based on the most recent Mortgage that was taken out on this home.
Original Mortgage
$391,290
Interest Rate
3.65%
Mortgage Type
VA
Purchase Details
Closed on
Jun 4, 2013
Sold by
Pjrj Lime Development Llc
Bought by
Lennar Homes Of California Inc
Purchase Details
Closed on
May 8, 2013
Sold by
Lennar Homes Of California Inc
Bought by
Pjrj Lime Development Llc
Create a Home Valuation Report for This Property
The Home Valuation Report is an in-depth analysis detailing your home's value as well as a comparison with similar homes in the area
Home Values in the Area
Average Home Value in this Area
Purchase History
| Date | Buyer | Sale Price | Title Company |
|---|---|---|---|
| Murphy Dustin P | -- | Lawyers Title | |
| Murphy Dustin | $391,500 | North American Title Company | |
| Lennar Homes Of California Inc | $34,898,500 | Fidelity National Title | |
| Pjrj Lime Development Llc | -- | Fidelity National Title |
Source: Public Records
Mortgage History
| Date | Status | Borrower | Loan Amount |
|---|---|---|---|
| Open | Murphy Dustin P | $350,000 | |
| Closed | Murphy Dustin | $391,290 |
Source: Public Records
Tax History Compared to Growth
Tax History
| Year | Tax Paid | Tax Assessment Tax Assessment Total Assessment is a certain percentage of the fair market value that is determined by local assessors to be the total taxable value of land and additions on the property. | Land | Improvement |
|---|---|---|---|---|
| 2025 | $6,188 | $470,273 | $96,148 | $374,125 |
| 2024 | $6,188 | $461,052 | $94,263 | $366,789 |
| 2023 | $5,581 | $452,012 | $92,415 | $359,597 |
| 2022 | $5,543 | $443,149 | $90,603 | $352,546 |
| 2021 | $5,475 | $434,459 | $88,826 | $345,633 |
| 2020 | $5,449 | $430,004 | $87,915 | $342,089 |
| 2019 | $5,307 | $421,572 | $86,191 | $335,381 |
| 2018 | $5,356 | $413,306 | $84,501 | $328,805 |
| 2017 | $5,303 | $405,202 | $82,844 | $322,358 |
| 2016 | $5,200 | $397,257 | $81,220 | $316,037 |
| 2015 | $2,052 | $112,707 | $112,707 | $0 |
| 2014 | $1,778 | $110,499 | $110,499 | $0 |
Source: Public Records
Map
Nearby Homes
- 15457 Red Pepper Place
- 7798 Poppy Ln
- 7868 Sea Salt Ave
- 15575 Allspice Ln
- 15195 Foothill Blvd
- 15677 Barbee St
- 15454 Raymond Ave
- 15783 Barbee St Unit 10
- 7575 Lime Ave
- 0 Foothill Blvd Unit CV25217423
- 7550 Periwinkle Dr
- 15797 Foothill Blvd
- 7651 Yellow Iris Ct
- 7434 Freeport Cir
- 7357 Elderberry Ct
- 7908 Tokay Ave Unit 108
- 14783 Ivy Ave
- 7600 Jacaranda Ave
- 7541 Catawba Dr
- 7239 Plumrose St
- 7920 Lemon Pepper Ave
- 7896 Lemon Pepper Ave
- 15334 Parsley Leaf Place
- 15331 Sugar Cane Ln
- 7888 Lemon Pepper Ave
- 15339 Sugar Cane Ln
- 7880 Lemon Pepper Ave
- 15342 Parsley Leaf Place
- 15332 Sugar Cane Ln
- 15347 Sugar Cane Ln
- 13580 Sugar Cane Ln
- 15346 Parsley Leaf Place
- 7872 Lemon Pepper Ave
- 15340 Sugar Cane Ln
- 15329 Parsley Leaf Place
- 15337 Parsley Leaf Place
- 15358 Parsley Leaf Place
- 15355 Sugar Cane Ln
- 15348 Sugar Cane Ln
- 15333 Chive Ln