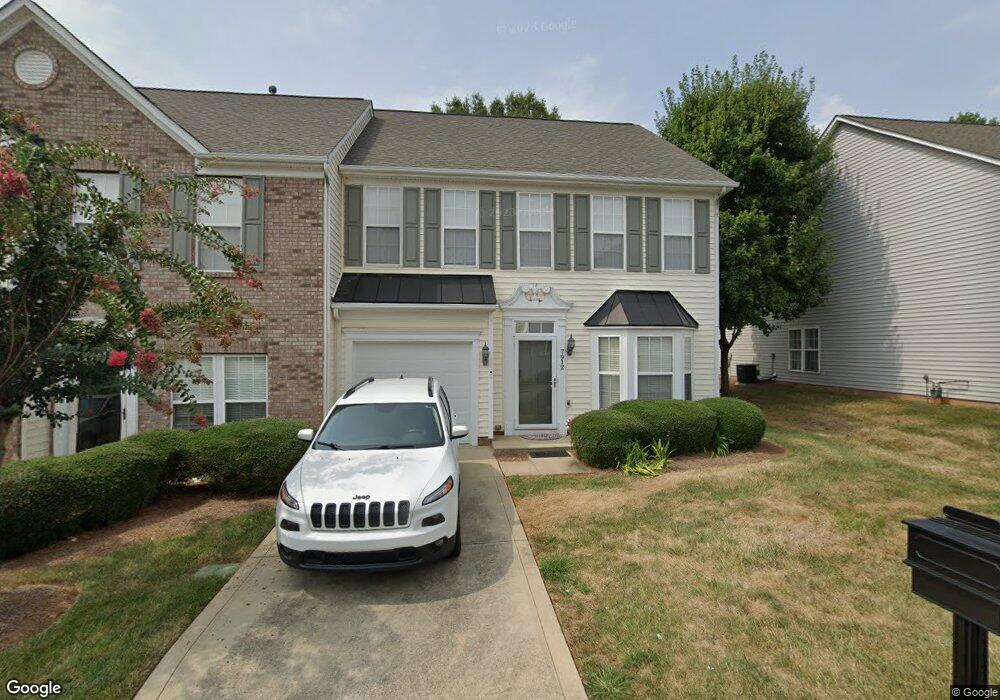
7912 Mariners Pointe Cir Denver, NC 28037
Estimated Value: $289,164 - $340,000
3
Beds
3
Baths
1,656
Sq Ft
$189/Sq Ft
Est. Value
About This Home
This home is located at 7912 Mariners Pointe Cir, Denver, NC 28037 and is currently estimated at $313,541, approximately $189 per square foot. 7912 Mariners Pointe Cir is a home located in Lincoln County with nearby schools including St. James Elementary School, East Lincoln Middle School, and East Lincoln High School.
Ownership History
Date
Name
Owned For
Owner Type
Purchase Details
Closed on
May 7, 2020
Sold by
Henderson David L
Bought by
Gershtenman Avsian Hagit and Avsian Osher
Current Estimated Value
Home Financials for this Owner
Home Financials are based on the most recent Mortgage that was taken out on this home.
Original Mortgage
$144,750
Outstanding Balance
$68,969
Interest Rate
3.5%
Mortgage Type
New Conventional
Estimated Equity
$244,572
Purchase Details
Closed on
Aug 21, 2008
Sold by
Brown Robert J
Bought by
Henderson David L
Home Financials for this Owner
Home Financials are based on the most recent Mortgage that was taken out on this home.
Original Mortgage
$104,300
Interest Rate
6.61%
Mortgage Type
Unknown
Purchase Details
Closed on
Jan 12, 2004
Bought by
Lafata Dorothy L
Purchase Details
Closed on
Oct 3, 2003
Bought by
Nvr Inc
Create a Home Valuation Report for This Property
The Home Valuation Report is an in-depth analysis detailing your home's value as well as a comparison with similar homes in the area
Purchase History
| Date | Buyer | Sale Price | Title Company |
|---|---|---|---|
| Gershtenman Avsian Hagit | $193,000 | None Available | |
| Henderson David L | $139,500 | None Available | |
| Lafata Dorothy L | $129,500 | -- | |
| Nvr Inc | $125,000 | -- |
Source: Public Records
Mortgage History
| Date | Status | Borrower | Loan Amount |
|---|---|---|---|
| Open | Gershtenman Avsian Hagit | $144,750 | |
| Previous Owner | Henderson David L | $104,300 |
Source: Public Records
Tax History
| Year | Tax Paid | Tax Assessment Tax Assessment Total Assessment is a certain percentage of the fair market value that is determined by local assessors to be the total taxable value of land and additions on the property. | Land | Improvement |
|---|---|---|---|---|
| 2025 | $1,997 | $307,481 | $37,000 | $270,481 |
| 2024 | $1,969 | $307,481 | $37,000 | $270,481 |
| 2023 | $1,964 | $307,481 | $37,000 | $270,481 |
| 2022 | $1,446 | $180,094 | $30,000 | $150,094 |
| 2021 | $1,455 | $180,094 | $30,000 | $150,094 |
| 2020 | $1,255 | $180,094 | $30,000 | $150,094 |
| 2019 | $1,255 | $180,094 | $30,000 | $150,094 |
| 2018 | $1,148 | $149,512 | $23,500 | $126,012 |
| 2017 | $1,047 | $149,512 | $23,500 | $126,012 |
| 2016 | $1,042 | $149,512 | $23,500 | $126,012 |
| 2015 | $1,153 | $149,512 | $23,500 | $126,012 |
| 2014 | $1,138 | $153,888 | $20,000 | $133,888 |
Source: Public Records
Map
Nearby Homes
- 7892 Mariners Pointe Cir
- 7948 Mariners Pointe Cir
- 2440 Mariners Cove Ln
- 2833 Sand Cove Ct
- 7903 Smith Pond Dr
- 7958 Unity Church Rd
- 2344 Smith Cove Rd
- 7200 Indigo Way
- 2378 Smith Harbour Dr
- 2028 Rock Springs Cir
- 1842 Rock Springs Cir
- 2550 Green Point Ln
- 6859 Lakecrest Ct
- 2325 Perry Rd
- 1751 Knights Dr
- 2514 Smith Harbour Dr
- 2456 W Nicole Ln
- 7208 Ogden Place
- 7217 Kenyon Dr
- 1855 Cameron Heights Cir
- 7914 Mariners Pointe Cir
- 7908 Mariners Pointe Cir Unit B
- 7908 Mariners Pointe Cir Unit 10
- 7916 Mariners Pointe Cir
- 7906 Mariners Pointe Cir
- 7906 Mariners Pointe Cir Unit 9
- 7918 Mariners Pointe Cir
- 7924 Mariners Pointe Cir
- 7926 Mariners Pointe Cir
- 2142 Sail Pointe Ct
- 2142 Sail Pointe Ln
- 7904 Mariners Pointe Cir
- 7904 Mariners Pointe Cir Unit C
- 7904 Mariners Pointe Cir Unit 8
- 7920 Mariners Pointe Cir
- 7929 Mariners Pointe Cir
- 2144 Sail Pointe Ln
- 2144 Sail Pointe Ct
- 2144 Sail Pointe Ln Unit 72
- 7931 Mariners Pointe Cir
Your Personal Tour Guide
Ask me questions while you tour the home.