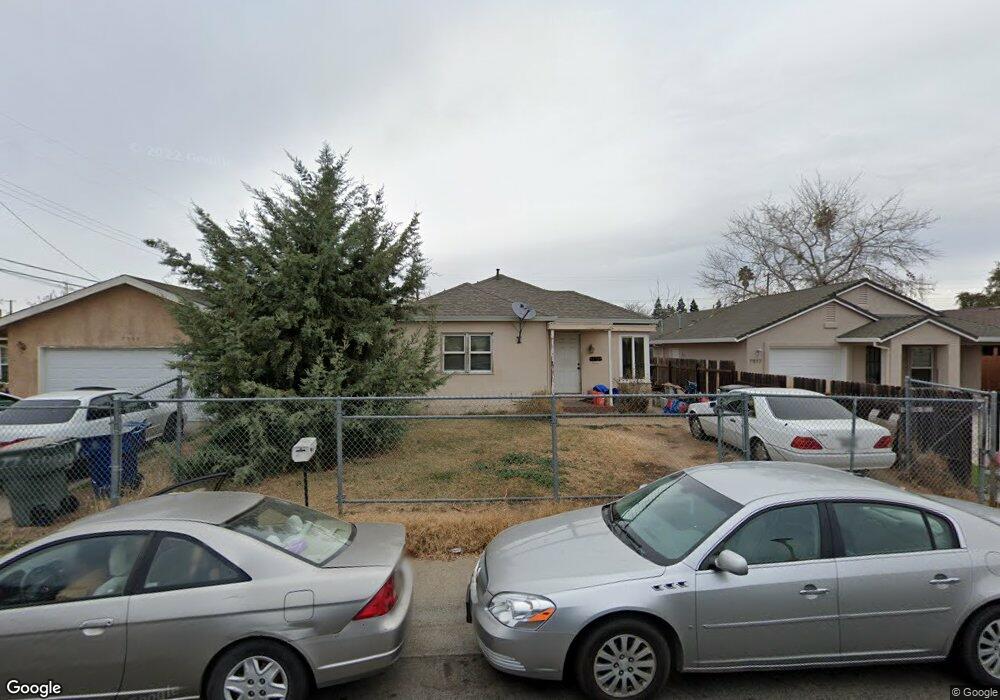
7913 33rd Ave Sacramento, CA 95824
Avondale NeighborhoodEstimated Value: $56,000 - $377,000
2
Beds
1
Bath
949
Sq Ft
$257/Sq Ft
Est. Value
About This Home
This home is located at 7913 33rd Ave, Sacramento, CA 95824 and is currently estimated at $243,577, approximately $256 per square foot. 7913 33rd Ave is a home located in Sacramento County with nearby schools including Earl Warren Elementary School, Will C. Wood Middle School, and Hiram W. Johnson High School.
Ownership History
Date
Name
Owned For
Owner Type
Purchase Details
Closed on
Mar 9, 2016
Sold by
Ham Phyllis
Bought by
Ham Phyllis M and Ham 2004 Revocable Living Trus
Current Estimated Value
Purchase Details
Closed on
Jun 10, 2008
Sold by
Alvarado Victorino and Henriquez Esperanza
Bought by
Wells Fargo Bank N A and Soundview Home Loan Trust
Purchase Details
Closed on
Mar 2, 2007
Sold by
Strandberg Tamara
Bought by
Alvarado Victorino and Henriquez Esperanza
Home Financials for this Owner
Home Financials are based on the most recent Mortgage that was taken out on this home.
Original Mortgage
$168,000
Interest Rate
8.25%
Mortgage Type
Balloon
Purchase Details
Closed on
Aug 4, 2005
Sold by
Bowens Michael Andrew and Estate Of Janett Bowens
Bought by
Strandberg Tamara
Home Financials for this Owner
Home Financials are based on the most recent Mortgage that was taken out on this home.
Original Mortgage
$143,500
Interest Rate
4.62%
Mortgage Type
Purchase Money Mortgage
Create a Home Valuation Report for This Property
The Home Valuation Report is an in-depth analysis detailing your home's value as well as a comparison with similar homes in the area
Home Values in the Area
Average Home Value in this Area
Purchase History
| Date | Buyer | Sale Price | Title Company |
|---|---|---|---|
| Ham Phyllis M | -- | None Available | |
| Wells Fargo Bank N A | $154,109 | None Available | |
| Alvarado Victorino | $210,000 | North American Title Co | |
| Strandberg Tamara | $205,000 | Fidelity National Title Co |
Source: Public Records
Mortgage History
| Date | Status | Borrower | Loan Amount |
|---|---|---|---|
| Previous Owner | Alvarado Victorino | $168,000 | |
| Previous Owner | Strandberg Tamara | $143,500 | |
| Previous Owner | Strandberg Tamara | $51,250 |
Source: Public Records
Tax History Compared to Growth
Tax History
| Year | Tax Paid | Tax Assessment Tax Assessment Total Assessment is a certain percentage of the fair market value that is determined by local assessors to be the total taxable value of land and additions on the property. | Land | Improvement |
|---|---|---|---|---|
| 2025 | $734 | $47,632 | $34,763 | $12,869 |
| 2024 | $734 | $46,699 | $34,082 | $12,617 |
| 2023 | $716 | $45,784 | $33,414 | $12,370 |
| 2022 | $703 | $44,887 | $32,759 | $12,128 |
| 2021 | $673 | $44,008 | $32,117 | $11,891 |
| 2020 | $673 | $43,558 | $31,788 | $11,770 |
| 2019 | $660 | $42,705 | $31,165 | $11,540 |
| 2018 | $643 | $41,868 | $30,554 | $11,314 |
| 2017 | $633 | $41,048 | $29,955 | $11,093 |
| 2016 | $615 | $40,244 | $29,368 | $10,876 |
| 2015 | $605 | $39,640 | $28,927 | $10,713 |
| 2014 | $592 | $38,865 | $28,361 | $10,504 |
Source: Public Records
Map
Nearby Homes
- 5690 Power Inn Rd
- 7909 35th Ave
- 7922 35th Ave
- 5618 Wilkinson St
- 8000 37th Ave
- 5331 Standish Rd
- 7440 38th Ave
- 7441 Peacock Way
- 7330 Peacock Way
- 4929 79th St
- 4950 76th St
- 5351 Whittier Dr
- 7021 Fruitridge Rd
- 5411 70th St
- 5240 Emerson Rd
- 4921 Concord Rd
- 4831 Quonset Dr
- 7787 21st Ave
- 5111 71st St
- 5020 Emerson Rd