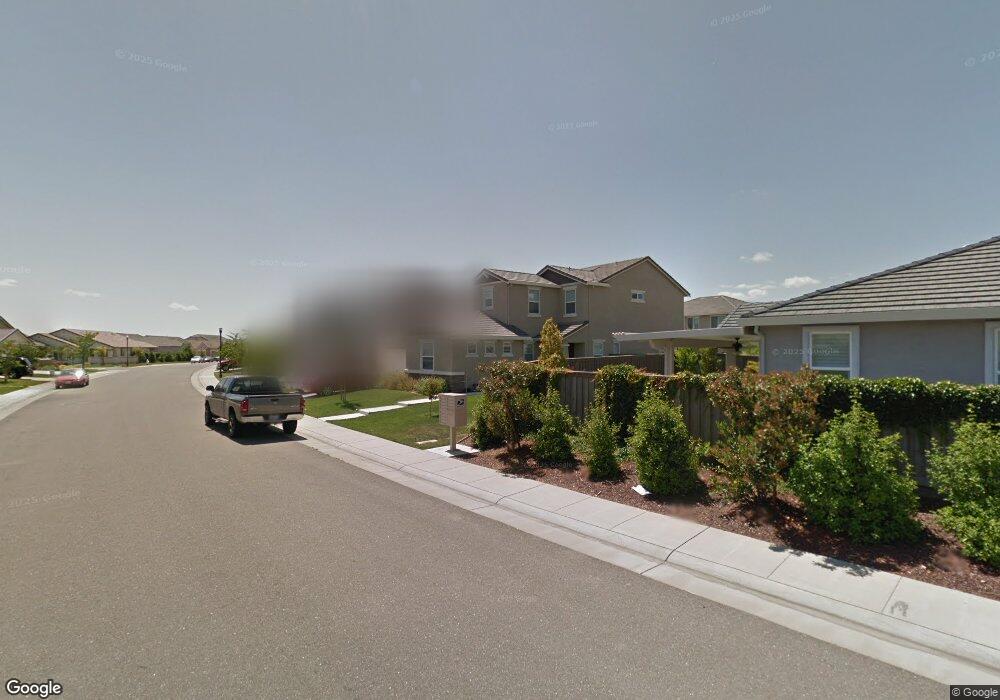
7913 Cordially Way Elk Grove, CA 95757
South West Elk Grove NeighborhoodEstimated Value: $734,000 - $815,932
4
Beds
4
Baths
2,785
Sq Ft
$277/Sq Ft
Est. Value
About This Home
This home is located at 7913 Cordially Way, Elk Grove, CA 95757 and is currently estimated at $771,733, approximately $277 per square foot. 7913 Cordially Way is a home with nearby schools including Zehnder Ranch Elementary, Elizabeth Pinkerton Middle School, and Cosumnes Oaks High School.
Ownership History
Date
Name
Owned For
Owner Type
Purchase Details
Closed on
Dec 8, 2021
Sold by
Jessica Ato
Bought by
Ato Jessica and Bove Sean P
Current Estimated Value
Home Financials for this Owner
Home Financials are based on the most recent Mortgage that was taken out on this home.
Original Mortgage
$315,000
Outstanding Balance
$289,209
Interest Rate
2.98%
Mortgage Type
New Conventional
Estimated Equity
$482,524
Purchase Details
Closed on
Dec 6, 2012
Sold by
Lennar Homes Of California Inc
Bought by
Ato Jessica
Home Financials for this Owner
Home Financials are based on the most recent Mortgage that was taken out on this home.
Original Mortgage
$379,342
Interest Rate
3.25%
Mortgage Type
FHA
Purchase Details
Closed on
Dec 27, 2010
Sold by
Sankey 380 Llc
Bought by
Lennar Homes Of California Inc
Purchase Details
Closed on
Nov 25, 2009
Sold by
Lennar Homes Of California Inc
Bought by
Sankey 380 Llc
Create a Home Valuation Report for This Property
The Home Valuation Report is an in-depth analysis detailing your home's value as well as a comparison with similar homes in the area
Home Values in the Area
Average Home Value in this Area
Purchase History
| Date | Buyer | Sale Price | Title Company |
|---|---|---|---|
| Ato Jessica | -- | North American Title | |
| Ato Jessica | $386,500 | North American Title Company | |
| Lennar Homes Of California Inc | $1,850,000 | Placer Title Company | |
| Sankey 380 Llc | -- | Placer Title Company |
Source: Public Records
Mortgage History
| Date | Status | Borrower | Loan Amount |
|---|---|---|---|
| Open | Ato Jessica | $315,000 | |
| Previous Owner | Ato Jessica | $379,342 |
Source: Public Records
Tax History Compared to Growth
Tax History
| Year | Tax Paid | Tax Assessment Tax Assessment Total Assessment is a certain percentage of the fair market value that is determined by local assessors to be the total taxable value of land and additions on the property. | Land | Improvement |
|---|---|---|---|---|
| 2025 | $9,523 | $513,620 | $92,350 | $421,270 |
| 2024 | $9,523 | $503,550 | $90,540 | $413,010 |
| 2023 | $9,221 | $493,677 | $88,765 | $404,912 |
| 2022 | $8,963 | $483,998 | $87,025 | $396,973 |
| 2021 | $8,675 | $469,509 | $85,319 | $384,190 |
| 2020 | $8,199 | $435,004 | $84,445 | $350,559 |
| 2019 | $8,048 | $426,476 | $82,790 | $343,686 |
| 2018 | $7,833 | $418,115 | $81,167 | $336,948 |
| 2017 | $7,672 | $409,918 | $79,576 | $330,342 |
| 2016 | $7,363 | $401,881 | $78,016 | $323,865 |
| 2015 | $7,207 | $395,846 | $76,845 | $319,001 |
| 2014 | $6,997 | $388,093 | $75,340 | $312,753 |
Source: Public Records
Map
Nearby Homes
- 7912 Cellana Dr
- 8125 Genex Way
- 9817 Westminster Way
- 7409 Rothschild Ct
- 7401 Rothschild Ct
- 9590 Oakham Way
- 7828 Barnsley Way
- 9648 Oakham Way
- 7632 Chatsworth Cir
- 7628 Chatsworth Cir
- 8284 Bonito Cir
- 9550 Village Tree Dr
- 9558 Dominion Wood Ln
- 7548 Chappelle Way
- 8340 La Cruz Way
- 9729 Allen Ranch Way
- 9793 Ellsmere Way
- 7521 Chappelle Way
- Plan 2 at Poppy Meadows - Primrose
- Plan 5 at Poppy Meadows - Primrose
- 7909 Cordially Way
- 7916 Cellana Dr
- 9789 Shanelyn Way
- 7905 Cordially Way
- 7908 Cellana Dr
- 7914 Cordially Way
- 9793 Shanelyn Way
- 7918 Cordially Way
- 7924 Cellana Dr
- 7910 Cordially Way
- 7901 Cordially Way
- 9797 Shanelyn Way
- 7906 Cordially Way
- 8000 Cellana Dr
- 7821 Cordially Way
- 9801 Shanelyn Way
- 8005 Spiess Ct
- 7900 Cellana Dr
- 9796 Shanelyn Way
- 8004 Cellana Dr