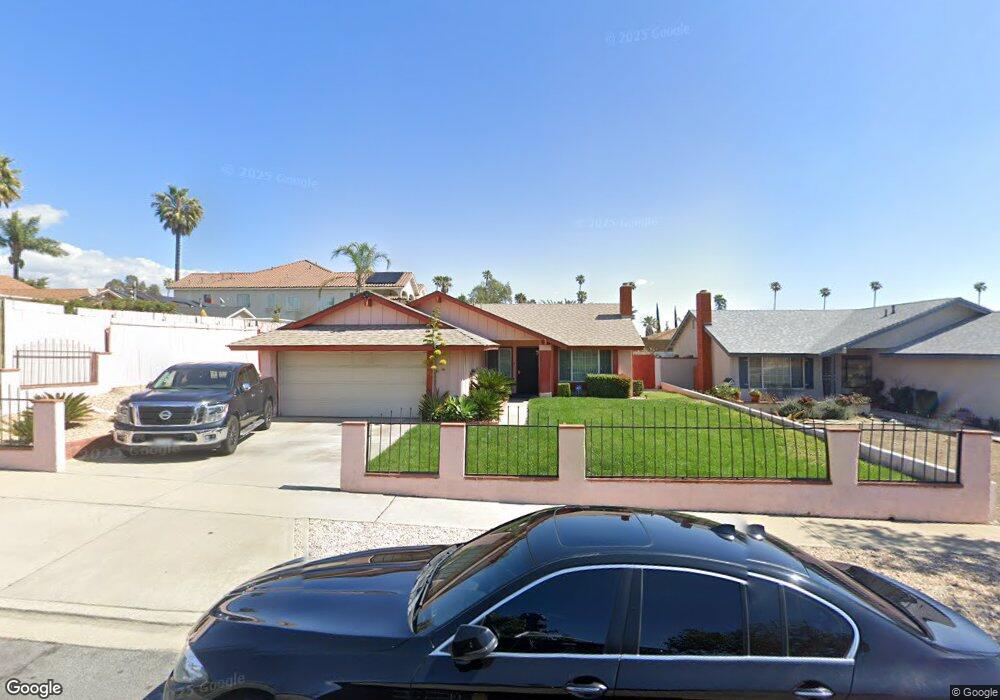
7913 Date St Fontana, CA 92336
Estimated Value: $573,000 - $595,367
4
Beds
2
Baths
1,352
Sq Ft
$435/Sq Ft
Est. Value
About This Home
This home is located at 7913 Date St, Fontana, CA 92336 and is currently estimated at $587,842, approximately $434 per square foot. 7913 Date St is a home located in San Bernardino County with nearby schools including Juniper Elementary School, Almeria Middle School, and Fontana A. B. Miller High School.
Ownership History
Date
Name
Owned For
Owner Type
Purchase Details
Closed on
Sep 27, 2007
Sold by
Cook Ollie and Cook Valerie
Bought by
Cook Ollie L and Cook Valerie Michelle
Current Estimated Value
Purchase Details
Closed on
Jun 14, 2005
Sold by
Cook Valerie and Cook Ollie
Bought by
Cook Ollie and Cook Valerie
Home Financials for this Owner
Home Financials are based on the most recent Mortgage that was taken out on this home.
Original Mortgage
$214,500
Interest Rate
5.72%
Mortgage Type
New Conventional
Purchase Details
Closed on
Oct 16, 2003
Sold by
Cook Ollie L and Cook Valerie Michelle
Bought by
Cook Ollie and Cook Valerie
Home Financials for this Owner
Home Financials are based on the most recent Mortgage that was taken out on this home.
Original Mortgage
$172,550
Interest Rate
6.14%
Mortgage Type
FHA
Purchase Details
Closed on
Apr 28, 2001
Sold by
Cook Ollie L and Cook Valerie M
Bought by
Cook Ollie L and Cook Valerie Michelle
Create a Home Valuation Report for This Property
The Home Valuation Report is an in-depth analysis detailing your home's value as well as a comparison with similar homes in the area
Purchase History
| Date | Buyer | Sale Price | Title Company |
|---|---|---|---|
| Cook Ollie L | -- | None Available | |
| Cook Ollie | -- | Lawyers Title Company | |
| Cook Ollie | -- | Investors Title | |
| Cook Ollie L | -- | -- |
Source: Public Records
Mortgage History
| Date | Status | Borrower | Loan Amount |
|---|---|---|---|
| Closed | Cook Ollie | $214,500 | |
| Closed | Cook Ollie | $172,550 |
Source: Public Records
Tax History
| Year | Tax Paid | Tax Assessment Tax Assessment Total Assessment is a certain percentage of the fair market value that is determined by local assessors to be the total taxable value of land and additions on the property. | Land | Improvement |
|---|---|---|---|---|
| 2025 | $2,173 | $160,468 | $32,497 | $127,971 |
| 2024 | $2,034 | $157,322 | $31,860 | $125,462 |
| 2023 | $1,558 | $154,237 | $31,235 | $123,002 |
| 2022 | $1,550 | $151,213 | $30,623 | $120,590 |
| 2021 | $1,529 | $148,248 | $30,023 | $118,225 |
| 2020 | $1,525 | $146,728 | $29,715 | $117,013 |
| 2019 | $1,477 | $143,851 | $29,132 | $114,719 |
| 2018 | $1,498 | $141,031 | $28,561 | $112,470 |
| 2017 | $1,488 | $138,266 | $28,001 | $110,265 |
| 2016 | $1,462 | $135,555 | $27,452 | $108,103 |
| 2015 | $1,442 | $133,519 | $27,040 | $106,479 |
| 2014 | $1,442 | $130,903 | $26,510 | $104,393 |
Source: Public Records
Map
Nearby Homes
- 8005 Oleander Ave
- 7900 Pinyon Ave
- 16304 Foothill Blvd
- 16195 Harvey Dr
- 8147 Cypress Ave
- 7740 Sewell Dr
- 7625 Cypress Ave
- 16203 Foothill Blvd
- 16470 Upland Ave
- 16329 Elaine Dr
- 16595 Upland Ave Unit E
- 16600 Terrace Ln
- 7918 Sierra Ave
- 16212 Owen St
- 16929 Reed St
- 0 Sierra Ave Unit IG25279606
- 16113 Upland Ave
- 7908 Tokay Ave Unit 107
- 16658 San Jacinto Ave
- 7714 Acacia Ave
Your Personal Tour Guide
Ask me questions while you tour the home.