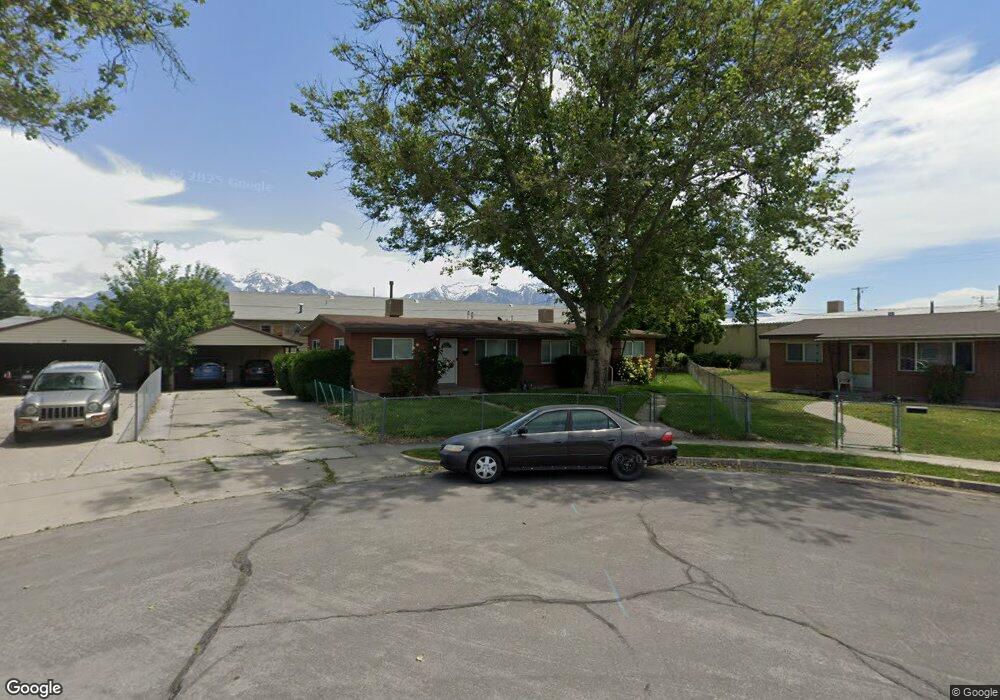
7913 Taft St Unit 7917 Midvale, UT 84047
Estimated Value: $486,363 - $631,000
4
Beds
2
Baths
1,652
Sq Ft
$346/Sq Ft
Est. Value
About This Home
This home is located at 7913 Taft St Unit 7917, Midvale, UT 84047 and is currently estimated at $572,341, approximately $346 per square foot. 7913 Taft St Unit 7917 is a home located in Salt Lake County with nearby schools including Midvale Elementary School, Midvale Middle School, and Hillcrest High School.
Ownership History
Date
Name
Owned For
Owner Type
Purchase Details
Closed on
Jul 2, 2013
Sold by
Fisher Allison S and Fisher Charles Jay
Bought by
Fisher Allison S and Fisher Charles Jay
Current Estimated Value
Home Financials for this Owner
Home Financials are based on the most recent Mortgage that was taken out on this home.
Original Mortgage
$122,000
Outstanding Balance
$87,385
Interest Rate
3.57%
Mortgage Type
New Conventional
Estimated Equity
$484,956
Purchase Details
Closed on
May 18, 2011
Sold by
Baer Lynette Dean and Butler Shauna Dean
Bought by
Fisher Allison S and Fisher Charles Jay
Home Financials for this Owner
Home Financials are based on the most recent Mortgage that was taken out on this home.
Original Mortgage
$119,722
Interest Rate
4.73%
Mortgage Type
New Conventional
Purchase Details
Closed on
Nov 13, 2000
Sold by
Dean Leo A and Dean Twila B
Bought by
Dean Leo A and Dean Twila B
Create a Home Valuation Report for This Property
The Home Valuation Report is an in-depth analysis detailing your home's value as well as a comparison with similar homes in the area
Home Values in the Area
Average Home Value in this Area
Purchase History
| Date | Buyer | Sale Price | Title Company |
|---|---|---|---|
| Fisher Allison S | -- | Bonneville Superior Title | |
| Fisher Allison S | -- | Inwest Title Services | |
| Dean Leo A | -- | -- |
Source: Public Records
Mortgage History
| Date | Status | Borrower | Loan Amount |
|---|---|---|---|
| Open | Fisher Allison S | $122,000 | |
| Closed | Fisher Allison S | $119,722 |
Source: Public Records
Tax History
| Year | Tax Paid | Tax Assessment Tax Assessment Total Assessment is a certain percentage of the fair market value that is determined by local assessors to be the total taxable value of land and additions on the property. | Land | Improvement |
|---|---|---|---|---|
| 2025 | $2,360 | $433,000 | $130,500 | $302,500 |
| 2024 | $2,360 | $402,600 | $123,500 | $279,100 |
| 2023 | $2,297 | $389,000 | $117,400 | $271,600 |
| 2022 | $2,444 | $404,300 | $115,100 | $289,200 |
| 2021 | $2,277 | $323,200 | $105,500 | $217,700 |
| 2020 | $1,861 | $250,200 | $76,700 | $173,500 |
| 2019 | $1,740 | $228,400 | $71,900 | $156,500 |
| 2016 | $1,642 | $204,800 | $71,900 | $132,900 |
Source: Public Records
Map
Nearby Homes
- 8147 S Roosevelt St
- 139 W Columbia Dr
- 135 E Station St
- 108 W Ryker Ln Unit 16
- 190 E White Spruce Cove Unit 805
- 197 W Center St
- 8218 S Coolidge St
- 76 Marquette Dr
- 222 W Center St
- 74 E Resaca Dr Unit B12
- 8229 S Resaca Dr Unit D3
- 116 E Resaca Dr Unit F2
- 90 E Resaca Dr Unit C11
- 7571 S Blisswood Dr #20 Dr Unit 20
- 117 E Calbourne Ln Unit I4
- 8264 S Resaca Dr Unit K9
- 36 E Opequon Rd
- 7824 S 280 E
- 257 E Water Mill Way
- 8278 S Resaca Dr Unit L1
- 7913 S Taft St
- 29 Mountain View Dr Unit 33
- 29 W Mountain View Dr
- 7891 Taft St Unit 7895
- 7927 Wilson St Unit 7931
- 7927 S Wilson St
- 7887 Taft St
- 7887 S Taft St
- 38 Mountain View Dr
- 7906 S State St
- 149 Taft St
- 7880 Taft St
- 46 Mountain View Dr
- 46 W Mountain View Dr
- 7930 S Wilson St
- 7930 Wilson St Unit 7934
- 7869 Taft St
- 7887 S Wilson St
- 7887 Wilson St
- 7942 S Wilson St Unit Duplex
Your Personal Tour Guide
Ask me questions while you tour the home.