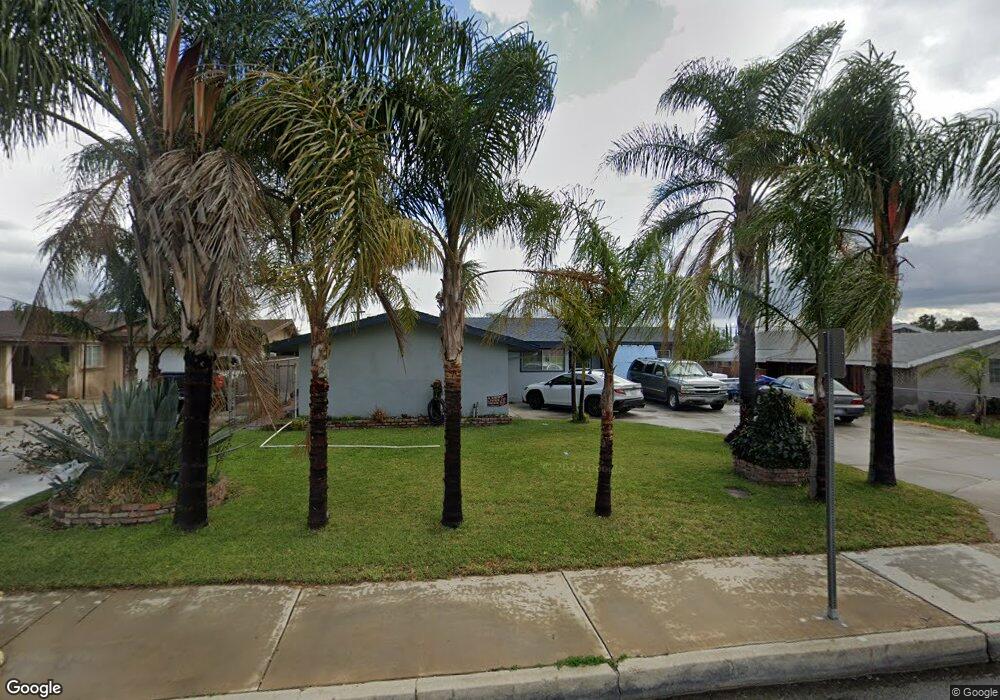
7915 Locust Ave Fontana, CA 92336
Estimated Value: $487,000 - $553,000
3
Beds
1
Bath
1,418
Sq Ft
$367/Sq Ft
Est. Value
About This Home
This home is located at 7915 Locust Ave, Fontana, CA 92336 and is currently estimated at $520,087, approximately $366 per square foot. 7915 Locust Ave is a home located in San Bernardino County with nearby schools including Virginia Primrose Elementary School, Alder Middle School, and Fontana A. B. Miller High School.
Ownership History
Date
Name
Owned For
Owner Type
Purchase Details
Closed on
Sep 1, 2004
Sold by
Bautista Miguel and Bautista Beronica
Bought by
Bautista Miguel and Bautista Beronica
Current Estimated Value
Home Financials for this Owner
Home Financials are based on the most recent Mortgage that was taken out on this home.
Original Mortgage
$182,000
Outstanding Balance
$91,248
Interest Rate
6.06%
Mortgage Type
New Conventional
Estimated Equity
$428,839
Purchase Details
Closed on
Jan 8, 2003
Sold by
Lillian Gerdwagon Family Living Trust
Bought by
Bautista Miguel and Bautista Baronica
Home Financials for this Owner
Home Financials are based on the most recent Mortgage that was taken out on this home.
Original Mortgage
$149,651
Interest Rate
5.76%
Mortgage Type
FHA
Purchase Details
Closed on
Jul 2, 2002
Sold by
Gerdwagon Lillian
Bought by
Gerdwagon Lillian and Lillian Gerdwagon Living Trust
Create a Home Valuation Report for This Property
The Home Valuation Report is an in-depth analysis detailing your home's value as well as a comparison with similar homes in the area
Purchase History
| Date | Buyer | Sale Price | Title Company |
|---|---|---|---|
| Bautista Miguel | -- | Lawyers Title Company | |
| Bautista Miguel | $152,000 | Commerce Title Company | |
| Gerdwagon Lillian | -- | -- |
Source: Public Records
Mortgage History
| Date | Status | Borrower | Loan Amount |
|---|---|---|---|
| Open | Bautista Miguel | $182,000 | |
| Closed | Bautista Miguel | $149,651 |
Source: Public Records
Tax History
| Year | Tax Paid | Tax Assessment Tax Assessment Total Assessment is a certain percentage of the fair market value that is determined by local assessors to be the total taxable value of land and additions on the property. | Land | Improvement |
|---|---|---|---|---|
| 2025 | $3,406 | $236,604 | $59,152 | $177,452 |
| 2024 | $3,172 | $231,965 | $57,992 | $173,973 |
| 2023 | $2,730 | $227,417 | $56,855 | $170,562 |
| 2022 | $2,701 | $222,958 | $55,740 | $167,218 |
| 2021 | $2,663 | $218,586 | $54,647 | $163,939 |
| 2020 | $2,642 | $216,345 | $54,087 | $162,258 |
| 2019 | $2,571 | $212,102 | $53,026 | $159,076 |
| 2018 | $2,586 | $207,943 | $51,986 | $155,957 |
| 2017 | $2,545 | $203,866 | $50,967 | $152,899 |
| 2016 | $2,481 | $199,869 | $49,968 | $149,901 |
| 2015 | $2,432 | $196,866 | $49,217 | $147,649 |
| 2014 | $2,419 | $193,010 | $48,253 | $144,757 |
Source: Public Records
Map
Nearby Homes
- 1597 W Mcwethy St
- 18173 Mccauley St
- 17765 Barbee St
- 18236 Owen St
- 17824 Ivy Ave
- 250 N Linden Ave Unit 124
- 250 N Linden Ave Unit 248
- 250 N Linden Ave Unit Spc 148
- 250 N Linden Ave Unit 327
- 250 N Linden Ave Unit 250
- 250 N Linden Ave
- 7719 Alder Ave
- 18206 Seville Ave
- 7656 Evergreen Ln
- 17844 Owen St
- 17640 Foothill Blvd
- 17748 Owen St
- 17562 Court St
- 1365 W Etiwanda Ave
- 1385 W Wedgewood St
- 7925 Locust Ave
- 7905 Locust Ave
- 7916 Spohn Ave
- 7935 Locust Ave
- 7926 Spohn Ave
- 7906 Spohn Ave
- 7887 Locust Ave
- 7936 Spohn Ave
- 7890 Spohn Ave
- 7945 Locust Ave
- 7880 Spohn Ave
- 7946 Spohn Ave
- 7875 Locust Ave
- 7955 Locust Ave
- 7871 Apple Ln
- 7887 Apple Ln
- 7870 Spohn Ave
- 7956 Spohn Ave
- 7867 Locust Ave
- 7915 Spohn Ave
Your Personal Tour Guide
Ask me questions while you tour the home.