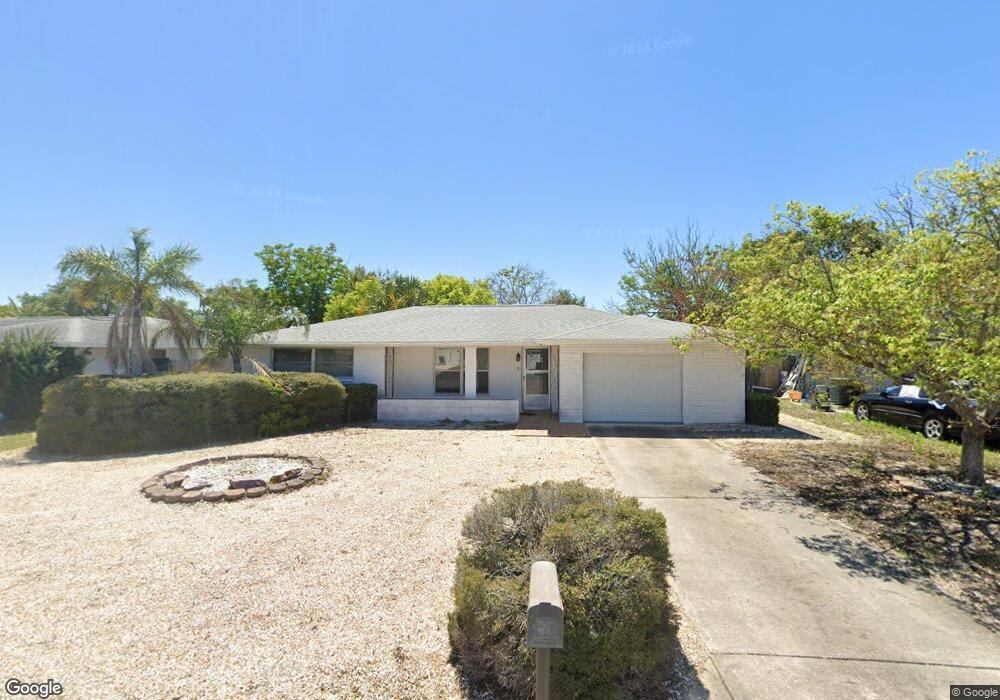
7916 Kelpie Dr Port Richey, FL 34668
Estimated Value: $165,000 - $237,000
2
Beds
2
Baths
1,739
Sq Ft
$120/Sq Ft
Est. Value
About This Home
This home is located at 7916 Kelpie Dr, Port Richey, FL 34668 and is currently estimated at $208,001, approximately $119 per square foot. 7916 Kelpie Dr is a home located in Pasco County with nearby schools including Fox Hollow Elementary School, Bayonet Point Middle School, and Fivay High School.
Ownership History
Date
Name
Owned For
Owner Type
Purchase Details
Closed on
Aug 15, 2024
Sold by
Clarity Properties Llc
Bought by
San Capital Llc
Current Estimated Value
Purchase Details
Closed on
Oct 10, 2014
Sold by
Clarity Holdings Llc
Bought by
Clarity Properties Llc
Purchase Details
Closed on
Mar 24, 2014
Sold by
Beckett Kenneth C and Beckett Patricia E
Bought by
Clarity Holdings Llc
Purchase Details
Closed on
Dec 31, 2013
Sold by
Beckett Kenneth C and Beckett Patricia E
Bought by
Clarity Holdings Llc
Home Financials for this Owner
Home Financials are based on the most recent Mortgage that was taken out on this home.
Original Mortgage
$37,500
Interest Rate
4.25%
Mortgage Type
Future Advance Clause Open End Mortgage
Purchase Details
Closed on
Nov 1, 2007
Sold by
Austin Carol
Bought by
Beckett Kenneth C and Beckett Patricia E
Create a Home Valuation Report for This Property
The Home Valuation Report is an in-depth analysis detailing your home's value as well as a comparison with similar homes in the area
Home Values in the Area
Average Home Value in this Area
Purchase History
| Date | Buyer | Sale Price | Title Company |
|---|---|---|---|
| San Capital Llc | $900,000 | Albatross Title Services | |
| Clarity Properties Llc | -- | None Available | |
| Clarity Holdings Llc | -- | Florida Instrastate Title Ll | |
| Clarity Holdings Llc | $50,000 | Sunset Title Services | |
| Beckett Kenneth C | $90,000 | Galaxy Title Agency Llc |
Source: Public Records
Mortgage History
| Date | Status | Borrower | Loan Amount |
|---|---|---|---|
| Previous Owner | Clarity Holdings Llc | $37,500 |
Source: Public Records
Tax History Compared to Growth
Tax History
| Year | Tax Paid | Tax Assessment Tax Assessment Total Assessment is a certain percentage of the fair market value that is determined by local assessors to be the total taxable value of land and additions on the property. | Land | Improvement |
|---|---|---|---|---|
| 2025 | $2,548 | $183,358 | $39,445 | $143,913 |
| 2024 | $2,548 | $189,665 | $39,445 | $150,220 |
| 2023 | $2,428 | $95,920 | $0 | $0 |
| 2022 | $1,951 | $154,215 | $22,395 | $131,820 |
| 2021 | $1,641 | $108,616 | $19,925 | $88,691 |
| 2020 | $1,515 | $99,964 | $12,705 | $87,259 |
| 2019 | $1,413 | $92,334 | $12,705 | $79,629 |
| 2018 | $1,270 | $78,614 | $12,705 | $65,909 |
| 2017 | $1,137 | $62,837 | $11,330 | $51,507 |
| 2016 | $981 | $50,960 | $8,030 | $42,930 |
| 2015 | $910 | $44,763 | $7,150 | $37,613 |
| 2014 | $864 | $43,224 | $7,150 | $36,074 |
Source: Public Records
Map
Nearby Homes
- 10200 Amadeus Dr
- 7922 Lilac Dr
- 7831 Fox Hollow Dr
- 10315 Pastel Ln
- 10310 Amadeus Dr Unit 6D
- 7811 Fox Hollow Dr
- 10220 Willow Dr
- 10226 Willow Dr
- 10133 Peoples Loop
- 10325 Gardenia Ln
- 7835 Bloomfield Dr
- 8207 National Dr
- 9830 Mark Twain Ln
- 9850 Richwood Ln
- 8105 Winthrop Dr
- 10301 Orchid Dr
- 10336 Oak Hill Dr
- 9826 Rainbow Ln
- 10401 Leaning Oak Dr
- 8020 Jasmine Blvd
- 7910 Kelpie Dr
- 7922 Kelpie Dr
- 7917 Mimosa Dr
- 7911 Mimosa Dr
- 7923 Mimosa Dr Unit 845
- 7906 Kelpie Dr
- 7917 Kelpie Dr
- 7911 Kelpie Dr
- 7905 Mimosa Dr
- 7900 Kelpie Dr Unit 6D
- 7905 Kelpie Dr
- 10138 Amadeus Dr
- 7901 Mimosa Dr
- 10206 Amadeus Dr
- 7943 Mimosa Dr
- 7916 Monarda Dr
- 7901 Kelpie Dr
- 7920 Mimosa Dr
- 7914 Mimosa Dr
- 7910 Monarda Dr