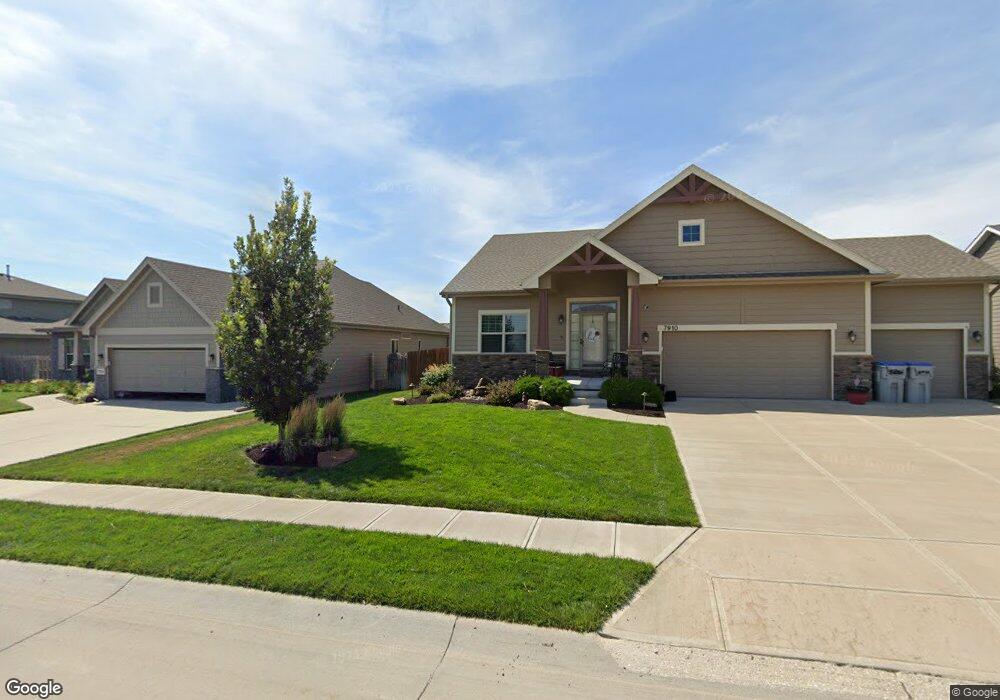
7916 S 193rd Ave Gretna, NE 68028
Estimated Value: $528,479 - $578,000
4
Beds
3
Baths
2,490
Sq Ft
$222/Sq Ft
Est. Value
About This Home
This home is located at 7916 S 193rd Ave, Gretna, NE 68028 and is currently estimated at $552,120, approximately $221 per square foot. 7916 S 193rd Ave is a home located in Sarpy County with nearby schools including Whitetail Creek Elementary School, Gretna Middle School, and Gretna High School.
Ownership History
Date
Name
Owned For
Owner Type
Purchase Details
Closed on
Oct 8, 2020
Sold by
Anderson Joan
Bought by
Sims Tyler and Sims Jamie
Current Estimated Value
Home Financials for this Owner
Home Financials are based on the most recent Mortgage that was taken out on this home.
Original Mortgage
$384,750
Outstanding Balance
$342,215
Interest Rate
2.9%
Mortgage Type
New Conventional
Estimated Equity
$209,905
Purchase Details
Closed on
Sep 28, 2016
Sold by
Silverstone Building Co Llc
Bought by
Anderson Joan and Anderson Robert D
Purchase Details
Closed on
Dec 16, 2015
Sold by
Boyer Young Equities Xiv Llc
Bought by
Silverstone Building Co Llc
Home Financials for this Owner
Home Financials are based on the most recent Mortgage that was taken out on this home.
Original Mortgage
$268,500
Interest Rate
3.98%
Mortgage Type
Construction
Create a Home Valuation Report for This Property
The Home Valuation Report is an in-depth analysis detailing your home's value as well as a comparison with similar homes in the area
Home Values in the Area
Average Home Value in this Area
Purchase History
| Date | Buyer | Sale Price | Title Company |
|---|---|---|---|
| Sims Tyler | -- | Aksarben Title & Escrow | |
| Anderson Joan | $373,000 | Ambassador Title Services | |
| Silverstone Building Co Llc | $55,000 | Pre |
Source: Public Records
Mortgage History
| Date | Status | Borrower | Loan Amount |
|---|---|---|---|
| Open | Sims Tyler | $384,750 | |
| Previous Owner | Silverstone Building Co Llc | $268,500 |
Source: Public Records
Tax History Compared to Growth
Tax History
| Year | Tax Paid | Tax Assessment Tax Assessment Total Assessment is a certain percentage of the fair market value that is determined by local assessors to be the total taxable value of land and additions on the property. | Land | Improvement |
|---|---|---|---|---|
| 2025 | $10,532 | $538,624 | $61,500 | $477,124 |
| 2024 | $10,808 | $520,976 | $58,500 | $462,476 |
| 2023 | $10,808 | $450,675 | $56,300 | $394,375 |
| 2022 | $11,141 | $429,699 | $56,300 | $373,399 |
| 2021 | $11,065 | $418,004 | $56,300 | $361,704 |
| 2020 | $4,743 | $405,377 | $55,000 | $350,377 |
| 2019 | $3,856 | $355,915 | $55,000 | $300,915 |
| 2018 | $3,957 | $345,830 | $55,000 | $290,830 |
| 2017 | $9,426 | $336,584 | $55,000 | $281,584 |
| 2016 | $1,543 | $55,000 | $55,000 | $0 |
| 2015 | $221 | $7,920 | $7,920 | $0 |
| 2014 | -- | $1,285 | $1,285 | $0 |
Source: Public Records
Map
Nearby Homes
- 7819 S 194th Ave
- 8023 S 193rd St
- 8004 S 195th St
- 8205 S 196th St
- 8137 S 197th Ave
- 19760 Briar St
- 8007 S 198th St
- 18595 Robin Dr
- 19654 Chandler St
- 19802 Cottonwood St
- 8139 S 198th St
- 8143 S 198th St
- 8147 S 198th St
- 19801 Greenleaf St
- 8125 S 198th Ave
- 18615 Robin Dr
- 19805 Greenleaf St
- 19809 Greenleaf St
- 19813 Greenleaf St
- Weston Plan at Remington West - Remington West CH
- 7916 S 193 Ave
- 7912 S 193rd Ave
- 8004 S 193rd Ave
- 7907 S 194th St
- 7908 S 193rd Ave
- 8008 S 193rd Ave
- 7911 S 194th St
- 7903 S 194th St
- 8005 S 193rd Ave
- 7915 S 194th St
- 7859 S 194th St
- 7904 S 193rd Ave
- 8012 S 193rd Ave
- 7911 S 193rd Ave
- 8009 S 193rd Ave
- 7907 S 193rd Ave
- 8003 S 194th St
- 8013 S 193rd Ave
- 7855 S 194th St
- 8016 S 193rd Ave