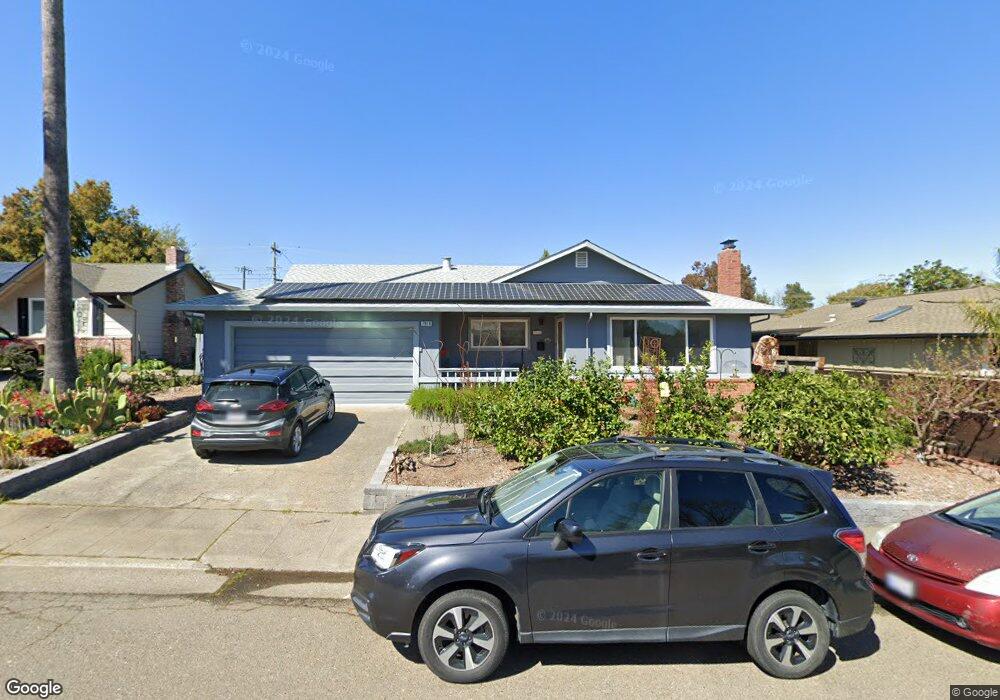
7918 Juanita Ct Sebastopol, CA 95472
Estimated Value: $811,000 - $1,068,000
2
Beds
2
Baths
1,254
Sq Ft
$756/Sq Ft
Est. Value
About This Home
This home is located at 7918 Juanita Ct, Sebastopol, CA 95472 and is currently estimated at $948,300, approximately $756 per square foot. 7918 Juanita Ct is a home located in Sonoma County with nearby schools including Park Side Elementary School, Brook Haven Elementary School, and Analy High School.
Ownership History
Date
Name
Owned For
Owner Type
Purchase Details
Closed on
Feb 5, 2021
Sold by
Cary Robert Bradford and Cary Cie
Bought by
Cary Robert B and Cary Cie
Current Estimated Value
Purchase Details
Closed on
Jun 29, 2016
Sold by
Pearson Patricia M and The Patricia M Pearson Trust
Bought by
Cie Cary Robert Bradford and Cie Cary
Home Financials for this Owner
Home Financials are based on the most recent Mortgage that was taken out on this home.
Original Mortgage
$300,000
Outstanding Balance
$239,491
Interest Rate
3.58%
Mortgage Type
New Conventional
Estimated Equity
$708,809
Purchase Details
Closed on
Mar 17, 2004
Sold by
Pearson Patricia
Bought by
Pearson Patricia M and Patricia M Pearson Trust
Purchase Details
Closed on
Feb 19, 2003
Sold by
Pearson Patricia and Pearson Walter
Bought by
Pearson Patricia
Purchase Details
Closed on
Dec 18, 2002
Sold by
Pearson Patricia and Pearson Walter
Bought by
Pearson Patricia
Create a Home Valuation Report for This Property
The Home Valuation Report is an in-depth analysis detailing your home's value as well as a comparison with similar homes in the area
Home Values in the Area
Average Home Value in this Area
Purchase History
| Date | Buyer | Sale Price | Title Company |
|---|---|---|---|
| Cary Robert B | -- | None Available | |
| Cie Cary Robert Bradford | $633,000 | Fidelity National Title Co | |
| Pearson Patricia M | -- | -- | |
| Pearson Patricia | -- | -- | |
| Pearson Patricia | -- | -- |
Source: Public Records
Mortgage History
| Date | Status | Borrower | Loan Amount |
|---|---|---|---|
| Open | Cie Cary Robert Bradford | $300,000 |
Source: Public Records
Tax History Compared to Growth
Tax History
| Year | Tax Paid | Tax Assessment Tax Assessment Total Assessment is a certain percentage of the fair market value that is determined by local assessors to be the total taxable value of land and additions on the property. | Land | Improvement |
|---|---|---|---|---|
| 2025 | $8,383 | $734,646 | $290,145 | $444,501 |
| 2024 | $8,383 | $720,242 | $284,456 | $435,786 |
| 2023 | $8,383 | $706,121 | $278,879 | $427,242 |
| 2022 | $8,095 | $692,276 | $273,411 | $418,865 |
| 2021 | $8,052 | $678,702 | $268,050 | $410,652 |
| 2020 | $8,023 | $671,744 | $265,302 | $406,442 |
| 2019 | $7,679 | $658,573 | $260,100 | $398,473 |
| 2018 | $7,564 | $645,660 | $255,000 | $390,660 |
| 2017 | $7,229 | $633,000 | $250,000 | $383,000 |
| 2016 | $1,460 | $111,217 | $25,745 | $85,472 |
| 2015 | $1,421 | $109,548 | $25,359 | $84,189 |
| 2014 | $1,401 | $107,403 | $24,863 | $82,540 |
Source: Public Records
Map
Nearby Homes
- 512 Norlee St
- 7826 Brookside Ave
- 476 Pleasant Hill Ave N
- 8023 Washington Ave
- 200 Pleasant Hill Ave N
- 105 Virginia Ave Unit 3
- 8148 Bodega Ave
- 7720 Bodega Ave Unit 3
- 7600 Bodega Ave
- 1220 Gravenstein Hwy N
- 5200 California 116
- 1300 Hwy 116 N
- 0 Bodega Hwy
- 451 S High St
- 7842 Joyce Dr
- 5301 Gravenstein Hwy S
- 830 Litchfield Ave
- 7580 Meadowlark Dr
- 7251 Fircrest Ave
- 7739 Lynch Rd
- 470 Zimpher Dr
- 7926 Juanita Ct
- 7919 Covert Ln
- 480 Zimpher Dr
- 7934 Juanita Ct
- 7927 Covert Ln
- 7917 Juanita Ct
- 7925 Juanita Ct
- 450 Zimpher Dr
- 7935 Covert Ln
- 471 Zimpher Dr
- 7942 Juanita Ct
- 461 Zimpher Dr
- 7933 Juanita Ct
- 7821 Covert Ln
- 7943 Covert Ln
- 451 Zimpher Dr
- 7941 Juanita Ct
- 472 Winding Wood Way
- 7910 Viola Ct