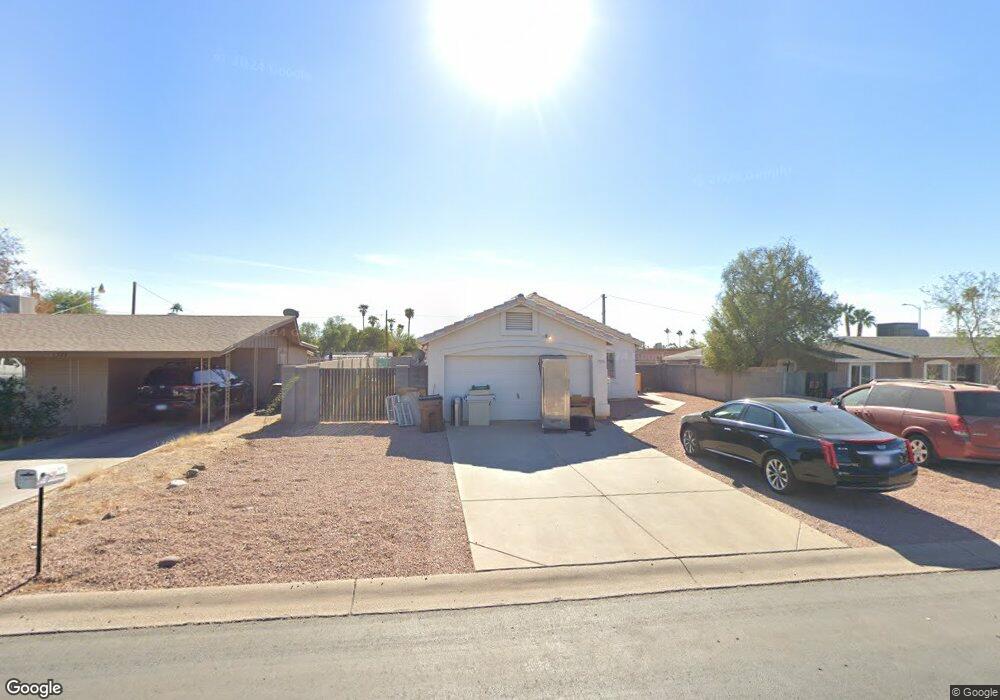
7919 E 3rd Ave Mesa, AZ 85208
Central Mesa East NeighborhoodEstimated Value: $333,000 - $363,372
3
Beds
2
Baths
1,139
Sq Ft
$306/Sq Ft
Est. Value
About This Home
This home is located at 7919 E 3rd Ave, Mesa, AZ 85208 and is currently estimated at $348,593, approximately $306 per square foot. 7919 E 3rd Ave is a home located in Maricopa County with nearby schools including Jefferson Elementary School, Franklin at Brimhall Elementary School, and Franklin West Elementary School.
Ownership History
Date
Name
Owned For
Owner Type
Purchase Details
Closed on
Jul 11, 2006
Sold by
Darko Gibson Y and Amoako Florence
Bought by
Darko Gibson Y
Current Estimated Value
Home Financials for this Owner
Home Financials are based on the most recent Mortgage that was taken out on this home.
Original Mortgage
$172,800
Outstanding Balance
$112,904
Interest Rate
8.55%
Mortgage Type
Balloon
Estimated Equity
$235,689
Purchase Details
Closed on
May 1, 1997
Sold by
Human Action For Chandler Inc
Bought by
Darko Gibson Y and Amoako Florence
Home Financials for this Owner
Home Financials are based on the most recent Mortgage that was taken out on this home.
Original Mortgage
$71,250
Interest Rate
7.91%
Mortgage Type
New Conventional
Purchase Details
Closed on
Oct 2, 1996
Sold by
Mason Glenn C and Mason Corine V
Bought by
Human Action For Chandler Inc
Create a Home Valuation Report for This Property
The Home Valuation Report is an in-depth analysis detailing your home's value as well as a comparison with similar homes in the area
Home Values in the Area
Average Home Value in this Area
Purchase History
| Date | Buyer | Sale Price | Title Company |
|---|---|---|---|
| Darko Gibson Y | -- | Premier Title Group Maricopa | |
| Darko Gibson Y | $20,000 | Transnation Title Ins Co | |
| Human Action For Chandler Inc | $14,500 | Transnation Title Ins Co |
Source: Public Records
Mortgage History
| Date | Status | Borrower | Loan Amount |
|---|---|---|---|
| Open | Darko Gibson Y | $172,800 | |
| Previous Owner | Darko Gibson Y | $71,250 | |
| Closed | Darko Gibson Y | $18,541 |
Source: Public Records
Tax History
| Year | Tax Paid | Tax Assessment Tax Assessment Total Assessment is a certain percentage of the fair market value that is determined by local assessors to be the total taxable value of land and additions on the property. | Land | Improvement |
|---|---|---|---|---|
| 2025 | $659 | $8,842 | -- | -- |
| 2024 | $674 | $8,421 | -- | -- |
| 2023 | $674 | $26,960 | $5,390 | $21,570 |
| 2022 | $657 | $19,660 | $3,930 | $15,730 |
| 2021 | $664 | $18,710 | $3,740 | $14,970 |
| 2020 | $659 | $16,220 | $3,240 | $12,980 |
| 2019 | $604 | $13,600 | $2,720 | $10,880 |
| 2018 | $588 | $11,820 | $2,360 | $9,460 |
| 2017 | $566 | $10,230 | $2,040 | $8,190 |
| 2016 | $551 | $9,760 | $1,950 | $7,810 |
| 2015 | $520 | $8,350 | $1,670 | $6,680 |
Source: Public Records
Map
Nearby Homes
- 8035 E 4th Ave
- 8101 E 4th Ave
- 8114 E 4th Ave
- 8019 E Main St
- 7750 E Broadway Rd Unit 776
- 7750 E Broadway Rd Unit 203
- 7750 E Broadway Rd Unit 724
- 7750 E Broadway Rd Unit 23
- 7750 E Broadway Rd Unit 270
- 7750 E Broadway Rd Unit 604
- 7750 E Broadway Rd Unit 906
- 7750 E Broadway Rd Unit 848
- 7750 E Broadway Rd Unit 453
- 7750 E Broadway Rd Unit 156
- 7750 E Broadway Rd Unit 662
- 7750 E Broadway Rd Unit 149
- 7750 E Broadway Rd Unit 463
- 7750 E Broadway Rd Unit 352
- 7750 E Broadway Rd Unit 734
- 7750 E Broadway Rd Unit 477
- 7923 E 3rd Ave
- 7915 E 3rd Ave
- 7927 E 3rd Ave
- 7918 E 4th Ave
- 7931 E 3rd Ave
- 7922 E 4th Ave
- 205 S 79th Place
- 7918 E 3rd Ave Unit 4
- 7918 E 3rd Ave
- 7922 E 3rd Ave
- 139 S 79th Place
- 7926 E 3rd Ave
- 7928 E 2nd Ave
- 7928 E 2nd Ave
- 7930 E 4th Ave
- 7750 E Broadway Rd Unit 390
- 7928 E 3rd Ave
- 7934 E 4th Ave
- 146 S 80th St
- 7930 E 3rd Ave
Your Personal Tour Guide
Ask me questions while you tour the home.