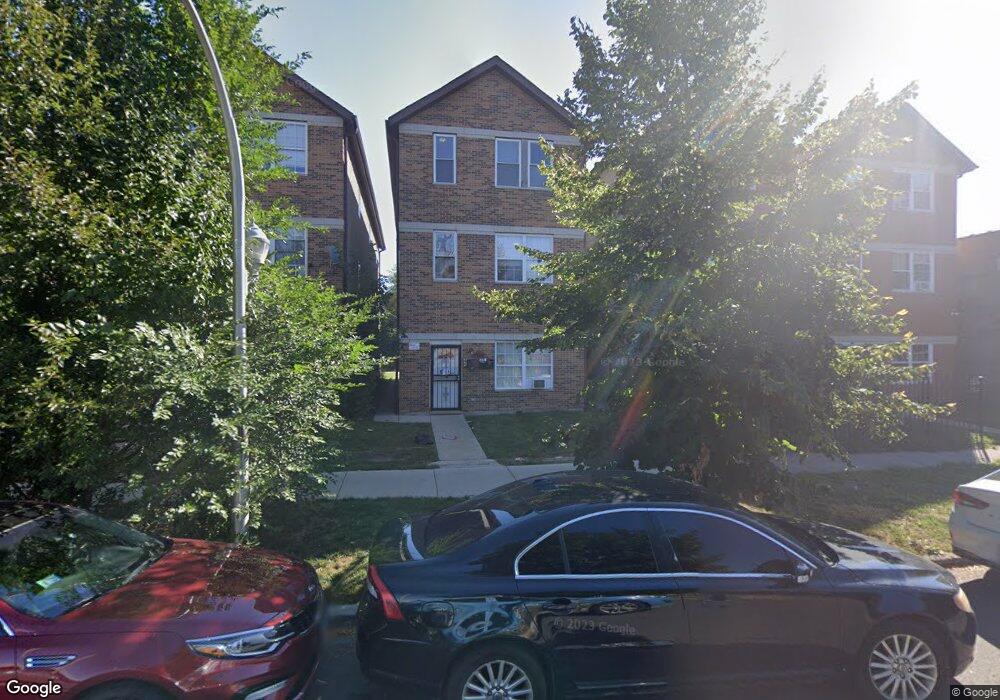
7919 S Phillips Ave Unit 2 Chicago, IL 60617
South Chicago NeighborhoodEstimated Value: $333,000
3
Beds
2
Baths
--
Sq Ft
3,093
Sq Ft Lot
About This Home
This home is located at 7919 S Phillips Ave Unit 2, Chicago, IL 60617 and is currently priced at $333,000. 7919 S Phillips Ave Unit 2 is a home located in Cook County with nearby schools including Coles Elementary Language Academy and Great Lakes Academy.
Ownership History
Date
Name
Owned For
Owner Type
Purchase Details
Closed on
Jul 31, 2017
Sold by
Khalil Wafika
Bought by
Affordable Homes For Rent I Llc
Current Estimated Value
Home Financials for this Owner
Home Financials are based on the most recent Mortgage that was taken out on this home.
Original Mortgage
$1,853,250
Interest Rate
9.99%
Mortgage Type
Commercial
Purchase Details
Closed on
Jul 22, 2011
Sold by
Fifth Third Bank
Bought by
Khalil Wafika
Purchase Details
Closed on
Jan 11, 2011
Sold by
Federal Home Loan Mortgage Corporation
Bought by
Fifth Third Bank
Purchase Details
Closed on
Oct 8, 2010
Sold by
Vasquez Nicole R
Bought by
Federal Home Loan Mortgage Corp
Purchase Details
Closed on
Nov 15, 2007
Sold by
Kelly John T
Bought by
Vasquez Nicole R
Home Financials for this Owner
Home Financials are based on the most recent Mortgage that was taken out on this home.
Original Mortgage
$225,000
Interest Rate
6.47%
Mortgage Type
Purchase Money Mortgage
Create a Home Valuation Report for This Property
The Home Valuation Report is an in-depth analysis detailing your home's value as well as a comparison with similar homes in the area
Home Values in the Area
Average Home Value in this Area
Purchase History
| Date | Buyer | Sale Price | Title Company |
|---|---|---|---|
| Affordable Homes For Rent I Llc | $56,500 | Greater Illinois Title | |
| Khalil Wafika | $7,500 | First American | |
| Fifth Third Bank | -- | None Available | |
| Federal Home Loan Mortgage Corp | -- | None Available | |
| Vasquez Nicole R | $250,000 | Ctic |
Source: Public Records
Mortgage History
| Date | Status | Borrower | Loan Amount |
|---|---|---|---|
| Previous Owner | Affordable Homes For Rent I Llc | $1,853,250 | |
| Previous Owner | Vasquez Nicole R | $225,000 |
Source: Public Records
Tax History Compared to Growth
Tax History
| Year | Tax Paid | Tax Assessment Tax Assessment Total Assessment is a certain percentage of the fair market value that is determined by local assessors to be the total taxable value of land and additions on the property. | Land | Improvement |
|---|---|---|---|---|
| 2019 | $5,655 | $28,147 | $1,021 | $27,126 |
| 2018 | $5,560 | $28,147 | $1,021 | $27,126 |
| 2017 | $2,923 | $13,577 | $918 | $12,659 |
| 2016 | $2,719 | $13,577 | $918 | $12,659 |
| 2015 | $2,488 | $13,577 | $918 | $12,659 |
| 2014 | $3,205 | $17,275 | $689 | $16,586 |
| 2013 | $3,142 | $17,275 | $689 | $16,586 |
Source: Public Records
Map
Nearby Homes
- 7915 S Phillips Ave
- 7623 S Essex Ave
- 7845 S Yates Blvd
- 7965 S Phillips Ave
- 7825 S Phillips Ave
- 7816 S Phillips Ave
- 8013 S Phillips Ave
- 7958 S Kingston Ave
- 8012 S Essex Ave Unit 3S
- 8023 S Yates Blvd
- 7834 S Oglesby Ave
- 7917 S Colfax Ave
- 7955 S Colfax Ave
- 8035 S Oglesby Ave
- 7831 S Colfax Ave
- 7730 S Essex Ave
- 7819 S Colfax Ave
- 7940 S Crandon Ave
- 7721 S Phillips Ave
- 8044 S Colfax Ave
- 7919 S Phillips Ave
- 7919 S Phillips Ave Unit 3
- 7919 S Phillips Ave Unit 1
- 7921 S Phillips Ave Unit 3
- 7921 S Phillips Ave Unit 2
- 7921 S Phillips Ave Unit 1
- 7921 S Phillips Ave
- 7917 S Phillips Ave Unit 3
- 7917 S Phillips Ave Unit 2
- 7917 S Phillips Ave Unit 1
- 7917 S Phillips Ave
- 7917 S Phillips Ave
- 7915 S Phillips Ave Unit 3
- 7915 S Phillips Ave Unit 2
- 7915 S Phillips Ave Unit 1
- 7915 S Phillips Ave Unit ONE
- 7923 S Phillips Ave
- 7925 S Phillips Ave
- 7922 S Essex Ave
- 7920 S Essex Ave