7919 Shawnee Dr Overland Park, KS 66212
Elmhurst NeighborhoodEstimated Value: $287,000 - $341,867
3
Beds
2
Baths
1,384
Sq Ft
$232/Sq Ft
Est. Value
About This Home
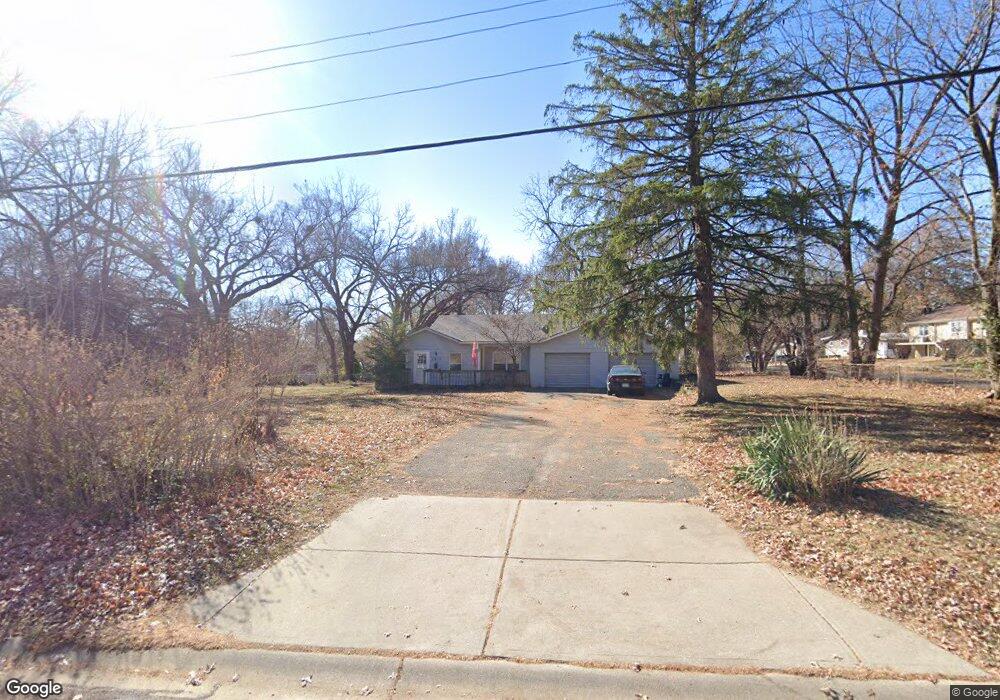
This home is located at 7919 Shawnee Dr, Overland Park, KS 66212 and is currently estimated at $321,717, approximately $232 per square foot. 7919 Shawnee Dr is a home located in Johnson County with nearby schools including Overland Park Elementary School, Westridge Middle School, and Shawnee Mission West High School.
Ownership History
Date
Name
Owned For
Owner Type
Purchase Details
Closed on
Jun 15, 2004
Sold by
Stuckey Michael B and Stuckey Susan K
Bought by
Miller Danny L
Current Estimated Value
Home Financials for this Owner
Home Financials are based on the most recent Mortgage that was taken out on this home.
Original Mortgage
$147,234
Outstanding Balance
$73,417
Interest Rate
6.3%
Mortgage Type
FHA
Estimated Equity
$248,300
Purchase Details
Closed on
Nov 30, 2001
Sold by
Emberton Barbara
Bought by
Stuckey Michael B and Stuckey Susan K
Home Financials for this Owner
Home Financials are based on the most recent Mortgage that was taken out on this home.
Original Mortgage
$102,000
Interest Rate
6.59%
Purchase Details
Closed on
Dec 29, 2000
Sold by
Gilmer John Michael and Gilmer Lisa S
Bought by
Emberton Barbara
Home Financials for this Owner
Home Financials are based on the most recent Mortgage that was taken out on this home.
Original Mortgage
$75,000
Interest Rate
7.78%
Create a Home Valuation Report for This Property
The Home Valuation Report is an in-depth analysis detailing your home's value as well as a comparison with similar homes in the area
Home Values in the Area
Average Home Value in this Area
Purchase History
| Date | Buyer | Sale Price | Title Company |
|---|---|---|---|
| Miller Danny L | -- | Chicago Title Insurance Comp | |
| Stuckey Michael B | -- | Chicago Title Insurance Co | |
| Emberton Barbara | -- | Security Land Title Company |
Source: Public Records
Mortgage History
| Date | Status | Borrower | Loan Amount |
|---|---|---|---|
| Open | Miller Danny L | $147,234 | |
| Previous Owner | Stuckey Michael B | $102,000 | |
| Previous Owner | Emberton Barbara | $75,000 |
Source: Public Records
Tax History Compared to Growth
Tax History
| Year | Tax Paid | Tax Assessment Tax Assessment Total Assessment is a certain percentage of the fair market value that is determined by local assessors to be the total taxable value of land and additions on the property. | Land | Improvement |
|---|---|---|---|---|
| 2024 | $3,189 | $33,327 | $9,819 | $23,508 |
| 2023 | $3,035 | $31,131 | $9,819 | $21,312 |
| 2022 | $2,829 | $29,233 | $9,819 | $19,414 |
| 2021 | $2,507 | $24,575 | $7,846 | $16,729 |
| 2020 | $2,464 | $24,184 | $6,272 | $17,912 |
| 2019 | $2,392 | $23,506 | $4,181 | $19,325 |
| 2018 | $2,209 | $21,620 | $4,181 | $17,439 |
| 2017 | $1,875 | $18,078 | $4,181 | $13,897 |
| 2016 | $1,880 | $17,836 | $4,181 | $13,655 |
| 2015 | $1,737 | $16,836 | $4,181 | $12,655 |
| 2013 | -- | $16,801 | $4,181 | $12,620 |
Source: Public Records
Map
Nearby Homes
- 8201 W 86th St
- 8538 Goodman St
- 8100 W 86th Terrace
- 8304 Hemlock St
- 8314 Hadley St
- 8564 W 85th St
- 8608 W 84th St
- 8330 Riley St
- 8638 W 85th St
- 8101 Goodman St
- 8113 Hadley St
- 8715 Mackey St
- 8201 Riley St
- 8020 Lowell Ave
- 7717 W 80th St
- Lexington Plan at Parkside Reserve - Premier Collection
- Brookside Plan at Parkside Reserve - Premier Collection
- Avalon Plan at Parkside Reserve - Premier Collection
- Crestwood Plan at Parkside Reserve - Premier Collection
- The Olympia Plan at Parkside Reserve
- 7915 Shawnee Dr
- 8401 Shawnee Ln
- 7929 Shawnee Dr
- 7905 Shawnee Dr
- 8407 Shawnee Ln
- 7910 Shawnee Dr
- 7911 Shawnee Dr
- 8404 Shawnee Ln
- 7928 Shawnee Dr
- 7932 Shawnee Dr
- 8415 Shawnee Ln
- 7901 Shawnee Dr
- 7918 W 85th St
- 8000 W 85th St
- 7908 Shawnee Dr
- 8410 Shawnee Ln
- 7914 W 85th St
- 8006 W 85th St
- 8430 Lowell Ave
- 7934 Shawnee Dr