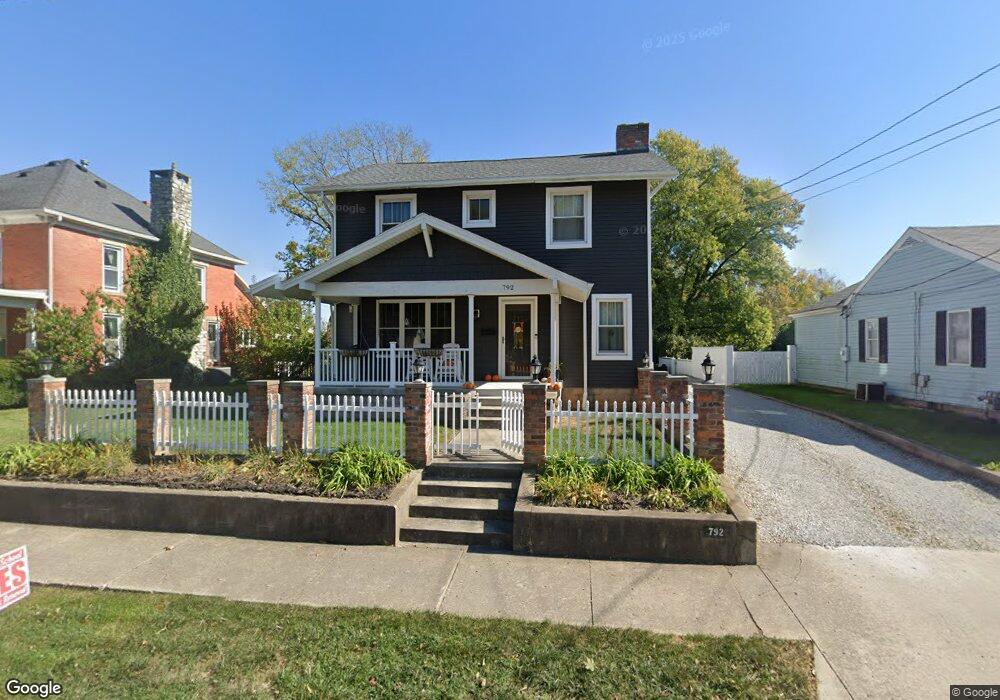
792 N High St Covington, OH 45318
Estimated Value: $255,000 - $281,000
4
Beds
2
Baths
2,256
Sq Ft
$117/Sq Ft
Est. Value
About This Home
This home is located at 792 N High St, Covington, OH 45318 and is currently estimated at $263,842, approximately $116 per square foot. 792 N High St is a home located in Miami County with nearby schools including Covington Elementary/Junior High School, Covington Junior High School, and Covington High School.
Ownership History
Date
Name
Owned For
Owner Type
Purchase Details
Closed on
Aug 5, 2016
Sold by
Richards Edward and Richards Cristy
Bought by
Lavey Nathaniel C and Lavey Josselyn N
Current Estimated Value
Home Financials for this Owner
Home Financials are based on the most recent Mortgage that was taken out on this home.
Original Mortgage
$104,500
Outstanding Balance
$82,011
Interest Rate
3.48%
Mortgage Type
New Conventional
Estimated Equity
$181,831
Purchase Details
Closed on
Mar 6, 2014
Sold by
Yohey Dewayne J and Yohey Diana L
Bought by
Richards Edward and Richards Cristy
Home Financials for this Owner
Home Financials are based on the most recent Mortgage that was taken out on this home.
Original Mortgage
$107,142
Interest Rate
4.24%
Mortgage Type
New Conventional
Purchase Details
Closed on
Aug 31, 1994
Sold by
Tobias David D
Bought by
Yohey Dewayne J and Yohey Diana L
Create a Home Valuation Report for This Property
The Home Valuation Report is an in-depth analysis detailing your home's value as well as a comparison with similar homes in the area
Home Values in the Area
Average Home Value in this Area
Purchase History
| Date | Buyer | Sale Price | Title Company |
|---|---|---|---|
| Lavey Nathaniel C | $110,000 | First American Title Ins Co | |
| Richards Edward | $105,000 | Vantage Land Title | |
| Yohey Dewayne J | $86,900 | -- |
Source: Public Records
Mortgage History
| Date | Status | Borrower | Loan Amount |
|---|---|---|---|
| Open | Lavey Nathaniel C | $104,500 | |
| Previous Owner | Richards Edward | $107,142 | |
| Closed | Yohey Dewayne J | -- |
Source: Public Records
Tax History
| Year | Tax Paid | Tax Assessment Tax Assessment Total Assessment is a certain percentage of the fair market value that is determined by local assessors to be the total taxable value of land and additions on the property. | Land | Improvement |
|---|---|---|---|---|
| 2025 | $2,716 | $83,200 | $9,660 | $73,540 |
| 2024 | $2,716 | $59,050 | $10,470 | $48,580 |
| 2023 | $2,212 | $59,050 | $10,470 | $48,580 |
| 2022 | $2,207 | $59,050 | $10,470 | $48,580 |
| 2021 | $1,394 | $34,550 | $8,050 | $26,500 |
| 2020 | $1,397 | $34,550 | $8,050 | $26,500 |
| 2019 | $1,404 | $34,550 | $8,050 | $26,500 |
| 2018 | $1,011 | $24,850 | $6,300 | $18,550 |
| 2017 | $1,029 | $24,850 | $6,300 | $18,550 |
| 2016 | $1,016 | $24,850 | $6,300 | $18,550 |
| 2015 | $960 | $23,910 | $6,060 | $17,850 |
| 2014 | $960 | $23,910 | $6,060 | $17,850 |
| 2013 | $927 | $23,910 | $6,060 | $17,850 |
Source: Public Records
Map
Nearby Homes
Your Personal Tour Guide
Ask me questions while you tour the home.