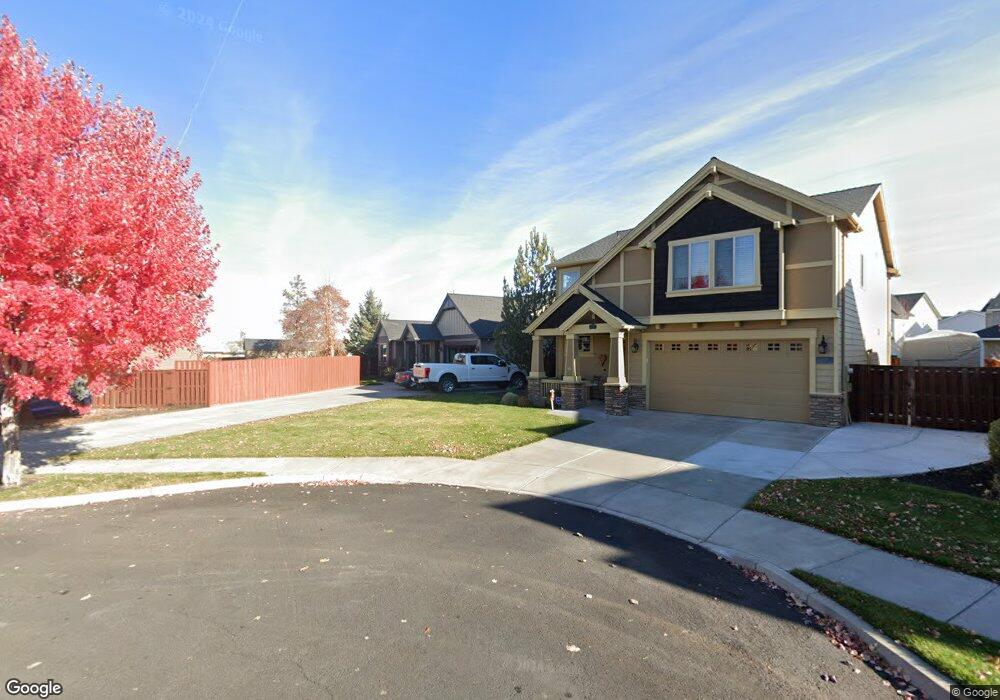
792 NW 28th Loop Redmond, OR 97756
Estimated Value: $514,273 - $562,000
3
Beds
2
Baths
1,804
Sq Ft
$299/Sq Ft
Est. Value
About This Home
This home is located at 792 NW 28th Loop, Redmond, OR 97756 and is currently estimated at $539,068, approximately $298 per square foot. 792 NW 28th Loop is a home located in Deschutes County with nearby schools including John Tuck Elementary School, Elton Gregory Middle School, and Redmond High School.
Ownership History
Date
Name
Owned For
Owner Type
Purchase Details
Closed on
Jul 29, 2010
Sold by
Holdeman Kenneth and Holdeman Arlene
Bought by
Blair Martha L
Current Estimated Value
Home Financials for this Owner
Home Financials are based on the most recent Mortgage that was taken out on this home.
Original Mortgage
$140,000
Outstanding Balance
$92,623
Interest Rate
4.71%
Mortgage Type
New Conventional
Estimated Equity
$446,445
Purchase Details
Closed on
Jul 30, 2009
Sold by
Zweifel Velton Kent and Zweifel Ann Marie
Bought by
Holdeman Ken and Holdeman Arlene
Purchase Details
Closed on
Nov 16, 2006
Sold by
Pahlisch Homes Inc
Bought by
Zweifel Velton Kent and Zweifel Ann Marie
Home Financials for this Owner
Home Financials are based on the most recent Mortgage that was taken out on this home.
Original Mortgage
$62,300
Interest Rate
6.36%
Mortgage Type
Stand Alone Second
Create a Home Valuation Report for This Property
The Home Valuation Report is an in-depth analysis detailing your home's value as well as a comparison with similar homes in the area
Home Values in the Area
Average Home Value in this Area
Purchase History
| Date | Buyer | Sale Price | Title Company |
|---|---|---|---|
| Blair Martha L | $175,000 | Amerititle | |
| Holdeman Ken | $127,200 | None Available | |
| Zweifel Velton Kent | $311,500 | Amerititle | |
| Pahlisch Homes Inc | $100,000 | Amerititle |
Source: Public Records
Mortgage History
| Date | Status | Borrower | Loan Amount |
|---|---|---|---|
| Open | Blair Martha L | $140,000 | |
| Previous Owner | Pahlisch Homes Inc | $62,300 | |
| Previous Owner | Zweifel Velton Kent | $249,200 |
Source: Public Records
Tax History
| Year | Tax Paid | Tax Assessment Tax Assessment Total Assessment is a certain percentage of the fair market value that is determined by local assessors to be the total taxable value of land and additions on the property. | Land | Improvement |
|---|---|---|---|---|
| 2025 | $4,347 | $213,220 | -- | -- |
| 2024 | $4,171 | $207,010 | -- | -- |
| 2023 | $3,989 | $200,990 | $0 | $0 |
| 2022 | $3,626 | $189,460 | $0 | $0 |
| 2021 | $3,506 | $183,950 | $0 | $0 |
| 2020 | $3,348 | $183,950 | $0 | $0 |
| 2019 | $3,202 | $178,600 | $0 | $0 |
| 2018 | $3,122 | $173,400 | $0 | $0 |
| 2017 | $3,048 | $168,350 | $0 | $0 |
| 2016 | $3,006 | $163,450 | $0 | $0 |
| 2015 | $2,914 | $158,690 | $0 | $0 |
| 2014 | $2,837 | $154,070 | $0 | $0 |
Source: Public Records
Map
Nearby Homes
- 2773 NW Greenwood Ave
- 654 NW 27th St
- 2433 NW Hazelwood Ave
- 2555 NW Ivy Way
- 537 NW 28th St
- 2372 NW Hazelwood Ave
- 2474 NW Kingwood Ave
- 411 NW 25th St
- 404 NW 25th St
- 2378 NW Kingwood Ave
- 388 NW 29th St
- 473 NW 30th St
- 3011 NW Dogwood Ave
- 1113 NW 22nd Place
- 2531 NW Cedar Ave
- 2531 NW Cedar Ave Unit 1-4
- 240 NW 30th St
- 2202 NW Cedar Ave
- 210 NW 27th Ct
- 3022 NW Boxelder Ave
- 788 NW 28th Loop
- 798 NW 28th Loop
- 782 NW 28th Loop
- 140 NW Hemlock Ave
- 138 NW Hemlock Ave
- 137 NW Hemlock Ave
- 136 NW Hemlock Ave
- 135 NW Hemlock Ave
- 133 NW Hemlock Ave
- 126 NW Hemlock Ave
- 124 NW Hemlock Ave
- 123 NW Hemlock Ave
- 122 NW Hemlock Ave
- 121 NW Hemlock Ave
- 120 NW Hemlock Ave
- 134 NW Hemlock Ave
- 125 NW Hemlock Ave
- 132 NW Hemlock Ave
- 0 NW 28th Loop
- 798 NW 27th St
Your Personal Tour Guide
Ask me questions while you tour the home.