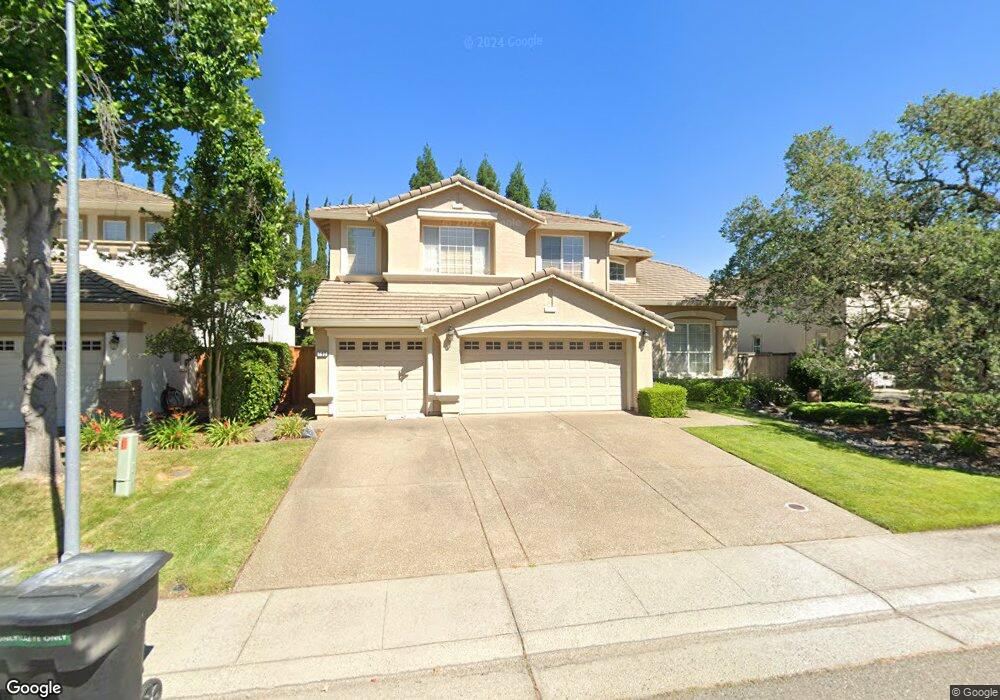
792 Travis St Folsom, CA 95630
Prairie Oaks NeighborhoodEstimated Value: $733,000 - $970,000
4
Beds
3
Baths
3,154
Sq Ft
$279/Sq Ft
Est. Value
About This Home
This home is located at 792 Travis St, Folsom, CA 95630 and is currently estimated at $879,075, approximately $278 per square foot. 792 Travis St is a home located in Sacramento County with nearby schools including Sandra J. Gallardo Elementary School, Sutter Middle School, and Folsom High School.
Ownership History
Date
Name
Owned For
Owner Type
Purchase Details
Closed on
Aug 25, 2020
Sold by
Ware Michael J and Ware Michelle N
Bought by
Ware Michael J and Ware Michelle N
Current Estimated Value
Purchase Details
Closed on
Jun 14, 2001
Sold by
Lennar Renaissance Inc
Bought by
Ware Michael J and Ware Michelle N
Home Financials for this Owner
Home Financials are based on the most recent Mortgage that was taken out on this home.
Original Mortgage
$271,200
Outstanding Balance
$103,381
Interest Rate
7.15%
Estimated Equity
$775,694
Create a Home Valuation Report for This Property
The Home Valuation Report is an in-depth analysis detailing your home's value as well as a comparison with similar homes in the area
Home Values in the Area
Average Home Value in this Area
Purchase History
We collect this data history from publicly available records. To have your information removed, we recommend requesting removal directly through your county’s website.
| Date | Buyer | Sale Price | Title Company |
|---|---|---|---|
| Ware Michael J | -- | None Available | |
| Ware Michael J | $339,500 | North American Title Guarant |
Source: Public Records
Mortgage History
We collect this data history from publicly available records. To have your information removed, we recommend requesting removal directly through your county’s website.
| Date | Status | Borrower | Loan Amount |
|---|---|---|---|
| Open | Ware Michael J | $271,200 |
Source: Public Records
Tax History
| Year | Tax Paid | Tax Assessment Tax Assessment Total Assessment is a certain percentage of the fair market value that is determined by local assessors to be the total taxable value of land and additions on the property. | Land | Improvement |
|---|---|---|---|---|
| 2025 | $6,218 | $537,076 | $135,602 | $401,474 |
| 2024 | $6,218 | $526,546 | $132,944 | $393,602 |
| 2023 | $6,106 | $516,223 | $130,338 | $385,885 |
| 2022 | $6,004 | $506,102 | $127,783 | $378,319 |
| 2021 | $5,930 | $496,179 | $125,278 | $370,901 |
| 2020 | $5,548 | $491,092 | $123,994 | $367,098 |
| 2019 | $5,458 | $481,463 | $121,563 | $359,900 |
| 2018 | $5,327 | $472,024 | $119,180 | $352,844 |
| 2017 | $6,828 | $462,770 | $116,844 | $345,926 |
| 2016 | $7,055 | $453,697 | $114,553 | $339,144 |
| 2015 | $6,815 | $446,883 | $112,833 | $334,050 |
| 2014 | $6,537 | $438,130 | $110,623 | $327,507 |
Source: Public Records
Map
Nearby Homes
- 820 Travis St
- 735 King Way
- 953 Carter St
- 124 Sutcliffe Cir
- 110 Royalton Cir
- 112 Royalton Cir
- 632 Fisher Cir
- 989 Carter St
- 904 Agee Ct
- 688 Humbert St
- 701 Ferrier Way
- 102 Black Gold Ln
- 2702 Ferry Cir Unit 102
- 706 Ward Way
- 145 Hopfield Dr
- 301 Russi Ct
- 307 Russi Ct
- 909 Blossom Rock Ln
- 108 Austin Dr
- 401 Seaton Dr
Your Personal Tour Guide
Ask me questions while you tour the home.