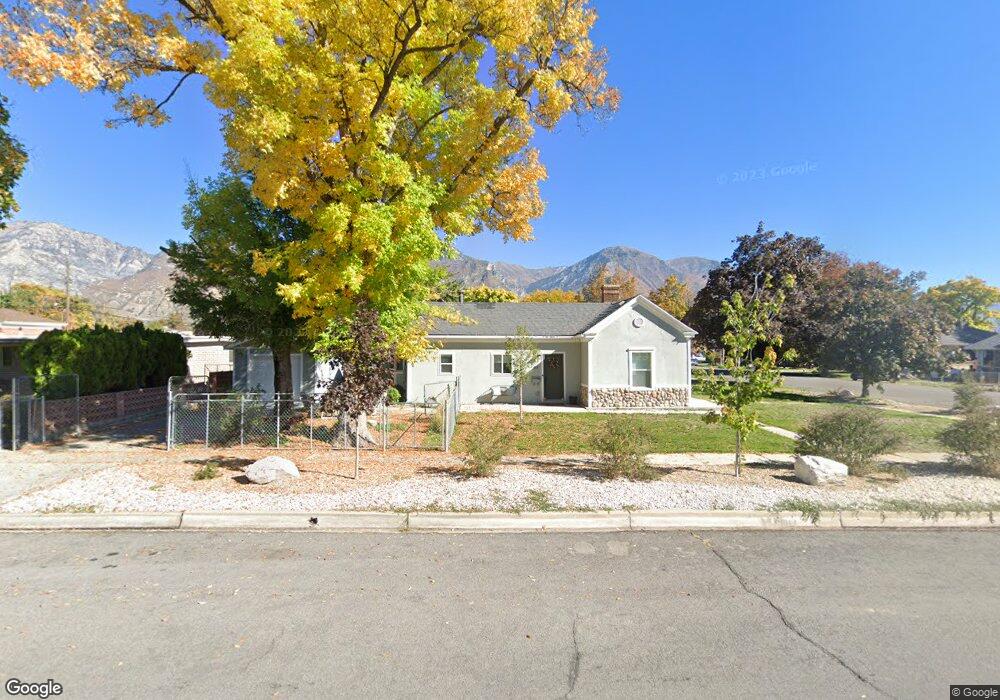
792 W 100 S Provo, UT 84601
Franklin NeighborhoodEstimated Value: $400,000 - $423,915
2
Beds
2
Baths
1,080
Sq Ft
$382/Sq Ft
Est. Value
About This Home
This home is located at 792 W 100 S, Provo, UT 84601 and is currently estimated at $412,229, approximately $381 per square foot. 792 W 100 S is a home located in Utah County with nearby schools including Franklin Elementary School, Dixon Middle School, and Provo High School.
Ownership History
Date
Name
Owned For
Owner Type
Purchase Details
Closed on
Sep 23, 2025
Sold by
East Windsong Investments Llc
Bought by
Acdc Properties Llc
Current Estimated Value
Purchase Details
Closed on
Feb 14, 2018
Sold by
Duke Parners Ii Llc
Bought by
East Windsong Investments Llc
Purchase Details
Closed on
Jun 1, 2017
Sold by
Snow Anthony
Bought by
Duke Parners Ii Llc
Purchase Details
Closed on
Jul 29, 2013
Sold by
Snow Steven J and Snow Bonnie
Bought by
Snow Anthony
Home Financials for this Owner
Home Financials are based on the most recent Mortgage that was taken out on this home.
Original Mortgage
$92,541
Interest Rate
3.75%
Mortgage Type
FHA
Purchase Details
Closed on
May 1, 2003
Sold by
Mitchell Richard
Bought by
Snow Anthony J
Purchase Details
Closed on
May 13, 1998
Sold by
Mitchell Richard Mark
Bought by
Snow Anthony James
Purchase Details
Closed on
Jan 13, 1996
Sold by
Mitchell Donald George and Workman Jean
Bought by
Mitchell Richard
Create a Home Valuation Report for This Property
The Home Valuation Report is an in-depth analysis detailing your home's value as well as a comparison with similar homes in the area
Home Values in the Area
Average Home Value in this Area
Purchase History
| Date | Buyer | Sale Price | Title Company |
|---|---|---|---|
| Acdc Properties Llc | -- | Real Advantage Title | |
| East Windsong Investments Llc | -- | Inwest Title | |
| Duke Parners Ii Llc | -- | North American Title | |
| Snow Anthony | -- | North American Title | |
| Snow Anthony J | -- | -- | |
| Snow Anthony James | -- | -- | |
| Mitchell Richard | -- | -- |
Source: Public Records
Mortgage History
| Date | Status | Borrower | Loan Amount |
|---|---|---|---|
| Previous Owner | Snow Anthony | $92,541 |
Source: Public Records
Tax History Compared to Growth
Tax History
| Year | Tax Paid | Tax Assessment Tax Assessment Total Assessment is a certain percentage of the fair market value that is determined by local assessors to be the total taxable value of land and additions on the property. | Land | Improvement |
|---|---|---|---|---|
| 2025 | $3,591 | $384,500 | $152,900 | $231,600 |
| 2024 | $3,591 | $353,500 | $0 | $0 |
| 2023 | $3,523 | $341,900 | $0 | $0 |
| 2022 | $3,508 | $343,200 | $155,200 | $188,000 |
| 2021 | $2,628 | $246,700 | $91,300 | $155,400 |
| 2020 | $2,534 | $223,000 | $83,000 | $140,000 |
| 2019 | $1,271 | $211,500 | $76,600 | $134,900 |
| 2018 | $1,169 | $197,300 | $73,400 | $123,900 |
| 2017 | $794 | $73,645 | $0 | $0 |
| 2016 | $756 | $65,340 | $0 | $0 |
| 2015 | $733 | $64,020 | $0 | $0 |
| 2014 | $663 | $60,390 | $0 | $0 |
Source: Public Records
Map
Nearby Homes