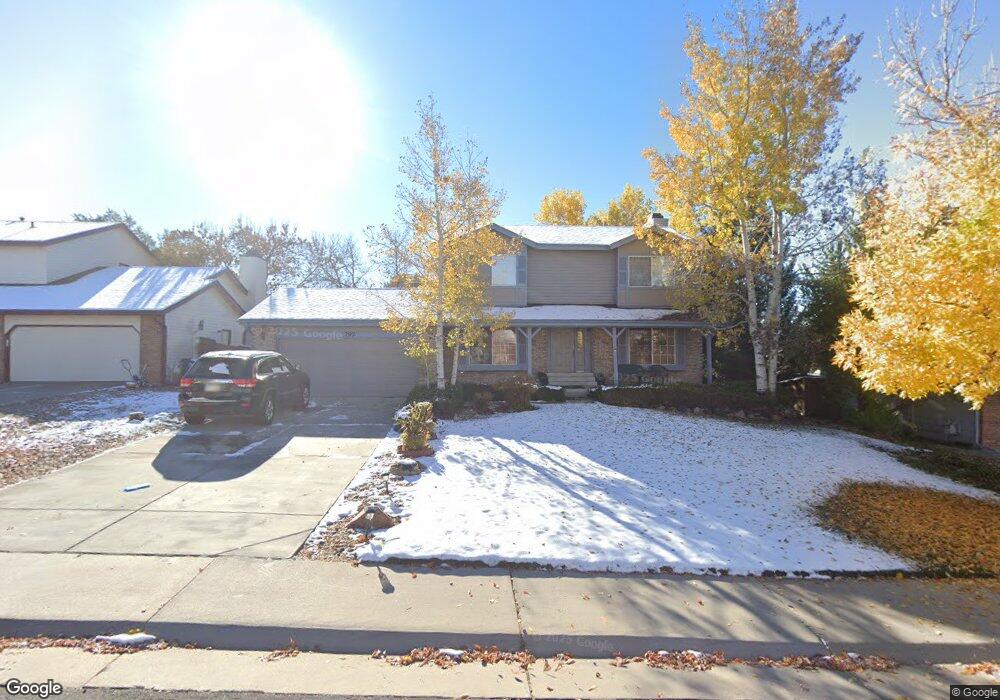
792 Windmill Place Highlands Ranch, CO 80126
Northridge NeighborhoodEstimated Value: $662,000 - $710,000
4
Beds
3
Baths
2,652
Sq Ft
$257/Sq Ft
Est. Value
About This Home
This home is located at 792 Windmill Place, Highlands Ranch, CO 80126 and is currently estimated at $682,667, approximately $257 per square foot. 792 Windmill Place is a home located in Douglas County with nearby schools including Northridge Elementary School, Mountain Ridge Middle School, and Mountain Vista High School.
Ownership History
Date
Name
Owned For
Owner Type
Purchase Details
Closed on
Jan 26, 2022
Sold by
Feldman David E
Bought by
Feldman Jeffrey Michael
Current Estimated Value
Purchase Details
Closed on
Jan 15, 2016
Sold by
Feldman Jeffrey Michael and Feldman Bari Lyn
Bought by
Feldman David E
Purchase Details
Closed on
Jun 25, 1998
Sold by
Michael Feldman Jeffrey
Bought by
Feldman Jeffrey Michael and Feldman Bari Lyn
Home Financials for this Owner
Home Financials are based on the most recent Mortgage that was taken out on this home.
Original Mortgage
$102,950
Interest Rate
7.13%
Purchase Details
Closed on
Mar 26, 1992
Sold by
Pineda David L and Pineda Renee M
Bought by
Feldman Jeffrey Michael
Purchase Details
Closed on
Feb 24, 1988
Sold by
Broadway Eugene H Jr & Broadway Charlott
Bought by
Pineda David L and Pineda Renee M
Purchase Details
Closed on
Oct 14, 1983
Sold by
Mission Viejo Co
Bought by
Broadway Eugene H and Broadway Charlotte Ann
Create a Home Valuation Report for This Property
The Home Valuation Report is an in-depth analysis detailing your home's value as well as a comparison with similar homes in the area
Home Values in the Area
Average Home Value in this Area
Purchase History
| Date | Buyer | Sale Price | Title Company |
|---|---|---|---|
| Feldman Jeffrey Michael | -- | New Title Company Name | |
| Feldman David E | $335,000 | Land Title Guarantee | |
| Feldman Jeffrey Michael | -- | Land Title | |
| Feldman Jeffrey Michael | $125,400 | -- | |
| Pineda David L | $112,500 | -- | |
| Broadway Eugene H | $125,800 | -- |
Source: Public Records
Mortgage History
| Date | Status | Borrower | Loan Amount |
|---|---|---|---|
| Previous Owner | Feldman Jeffrey Michael | $102,950 |
Source: Public Records
Tax History Compared to Growth
Tax History
| Year | Tax Paid | Tax Assessment Tax Assessment Total Assessment is a certain percentage of the fair market value that is determined by local assessors to be the total taxable value of land and additions on the property. | Land | Improvement |
|---|---|---|---|---|
| 2024 | $3,987 | $45,980 | $10,950 | $35,030 |
| 2023 | $3,980 | $45,980 | $10,950 | $35,030 |
| 2022 | $2,987 | $32,690 | $7,430 | $25,260 |
| 2021 | $3,106 | $32,690 | $7,430 | $25,260 |
| 2020 | $2,883 | $31,080 | $7,130 | $23,950 |
| 2019 | $2,893 | $31,080 | $7,130 | $23,950 |
| 2018 | $2,617 | $27,690 | $6,210 | $21,480 |
| 2017 | $2,383 | $27,690 | $6,210 | $21,480 |
| 2016 | $1,998 | $22,790 | $6,190 | $16,600 |
| 2015 | $2,041 | $22,790 | $6,190 | $16,600 |
| 2014 | $1,775 | $18,300 | $4,940 | $13,360 |
Source: Public Records
Map
Nearby Homes
- 904 Fieldstone Place
- 8473 Tanglewood St
- 804 Homestead Dr
- 1241 Northcrest Dr
- 843 Homestead Dr
- 8397 Cobblestone Ct
- 8725 Meadowlark Cir
- 8376 Cobblestone St
- 8745 Meadowlark Cir
- 1186 Cobblestone Dr
- 1384 Briar Cir
- 714 Old Stone Dr
- 8822 Eagles Nest Ln
- 507 Fox Hunt Cir
- 1431 Northcrest Dr
- 8606 Meadowlark Cir
- 8441 Timberwood St
- 1551 Northridge Dr
- 8823 Maplewood Dr
- 8196 S Logan Ct
- 802 Windmill Place
- 762 Windmill Place
- 803 Honeysuckle Place
- 783 Honeysuckle Place
- 852 Windmill Place
- 742 Windmill Place
- 833 Honeysuckle Place
- 781 Windmill Place
- 801 Windmill Place
- 763 Honeysuckle Place
- 761 Windmill Place
- 851 Windmill Place
- 722 Windmill Place
- 731 Windmill Place
- 743 Honeysuckle Place
- 863 Honeysuckle Place
- 780 Prairie Ridge Rd
- 701 Windmill Place
- 902 Chimney Rock Rd
- 740 Prairie Ridge Rd