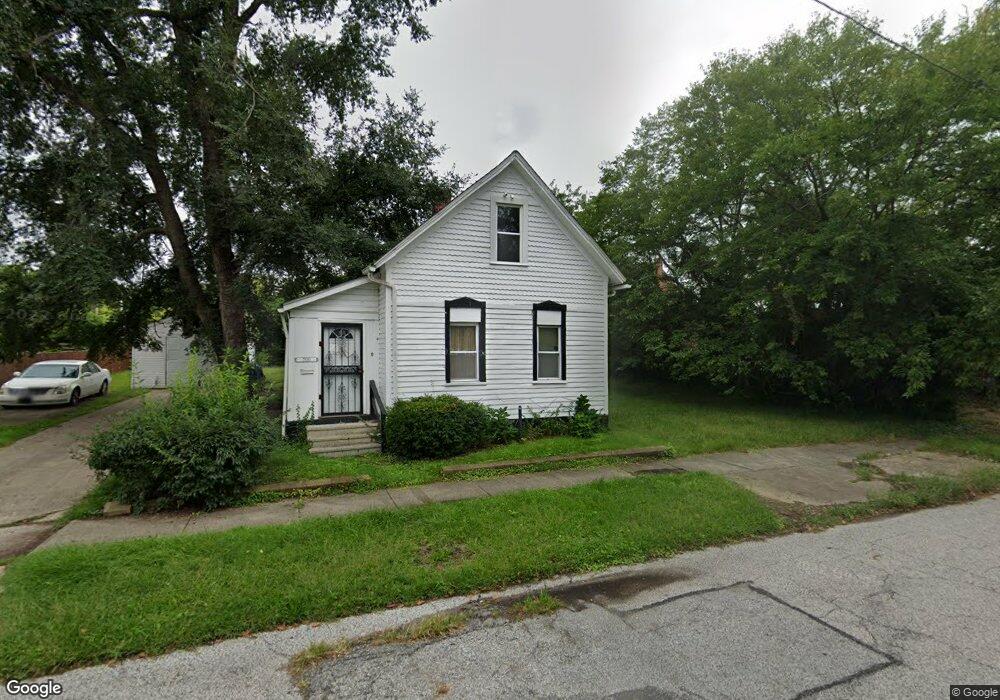
7920 Amos Ave Cleveland, OH 44104
Fairfax NeighborhoodEstimated Value: $18,000 - $136,000
2
Beds
2
Baths
1,002
Sq Ft
$76/Sq Ft
Est. Value
About This Home
This home is located at 7920 Amos Ave, Cleveland, OH 44104 and is currently estimated at $76,240, approximately $76 per square foot. 7920 Amos Ave is a home located in Cuyahoga County with nearby schools including Bolton, Anton Grdina School, and Andrew J. Rickoff School.
Ownership History
Date
Name
Owned For
Owner Type
Purchase Details
Closed on
May 20, 2021
Sold by
Norris Kimberly
Bought by
Hopper Juwana
Current Estimated Value
Home Financials for this Owner
Home Financials are based on the most recent Mortgage that was taken out on this home.
Original Mortgage
$103,098
Interest Rate
3.1%
Mortgage Type
FHA
Purchase Details
Closed on
Nov 20, 2018
Sold by
Estate Of Robert T Arnold
Bought by
Lee Dorothea A
Purchase Details
Closed on
Aug 24, 2000
Sold by
Arnold Robert
Bought by
Fairfax Renaissance Development Corp
Purchase Details
Closed on
Jul 5, 2000
Sold by
Murray Wilton W and Murray Catherine I
Bought by
Fairfax Renaissance Development Corp
Purchase Details
Closed on
Mar 31, 1998
Sold by
Daniels Joseph
Bought by
Arnold Robert
Home Financials for this Owner
Home Financials are based on the most recent Mortgage that was taken out on this home.
Original Mortgage
$15,000
Interest Rate
7.27%
Create a Home Valuation Report for This Property
The Home Valuation Report is an in-depth analysis detailing your home's value as well as a comparison with similar homes in the area
Home Values in the Area
Average Home Value in this Area
Purchase History
| Date | Buyer | Sale Price | Title Company |
|---|---|---|---|
| Hopper Juwana | $105,000 | Gm Title | |
| Lee Dorothea A | -- | None Available | |
| Fairfax Renaissance Development Corp | $1,000 | Surety Title Agency Inc | |
| Fairfax Renaissance Development Corp | $75,000 | Equity Title Agency Inc | |
| Arnold Robert | -- | First Service Title Agency I |
Source: Public Records
Mortgage History
| Date | Status | Borrower | Loan Amount |
|---|---|---|---|
| Previous Owner | Hopper Juwana | $103,098 | |
| Previous Owner | Arnold Robert | $15,000 |
Source: Public Records
Tax History Compared to Growth
Tax History
| Year | Tax Paid | Tax Assessment Tax Assessment Total Assessment is a certain percentage of the fair market value that is determined by local assessors to be the total taxable value of land and additions on the property. | Land | Improvement |
|---|---|---|---|---|
| 2024 | -- | $17,710 | $4,515 | $13,195 |
| 2023 | $1,479 | $8,720 | $2,420 | $6,300 |
| 2022 | $1,479 | $8,715 | $2,415 | $6,300 |
| 2021 | $707 | $8,720 | $2,420 | $6,300 |
| 2020 | $0 | $8,090 | $2,240 | $5,850 |
| 2019 | $801 | $23,100 | $6,400 | $16,700 |
| 2018 | $5,351 | $8,090 | $2,240 | $5,850 |
| 2017 | $577 | $7,000 | $1,260 | $5,740 |
| 2016 | $2,084 | $7,000 | $1,260 | $5,740 |
| 2015 | $3,348 | $7,000 | $1,260 | $5,740 |
| 2014 | $3,348 | $6,650 | $1,190 | $5,460 |
Source: Public Records
Map
Nearby Homes
- 2254 E 81st St
- 2429 E 84th St
- 7305 Montgomery Ave
- 2437 E 84th St
- 7211 Chamberlain Ave
- 2256 E 85th St
- 2221 E 76th St
- 0 E 86th St Unit 5150892
- 2194 E 80th St
- 2246 E 86th St
- 2237 E 73rd St
- 2181 E 82nd St
- 2201 E 86th St
- 2216 E 71st St
- 2292 E 90th St
- 2622 E 75th St
- 7207 Otis Ct
- 2309 E 93rd St
- 2288 E 95th St
- 2179 E 93rd St