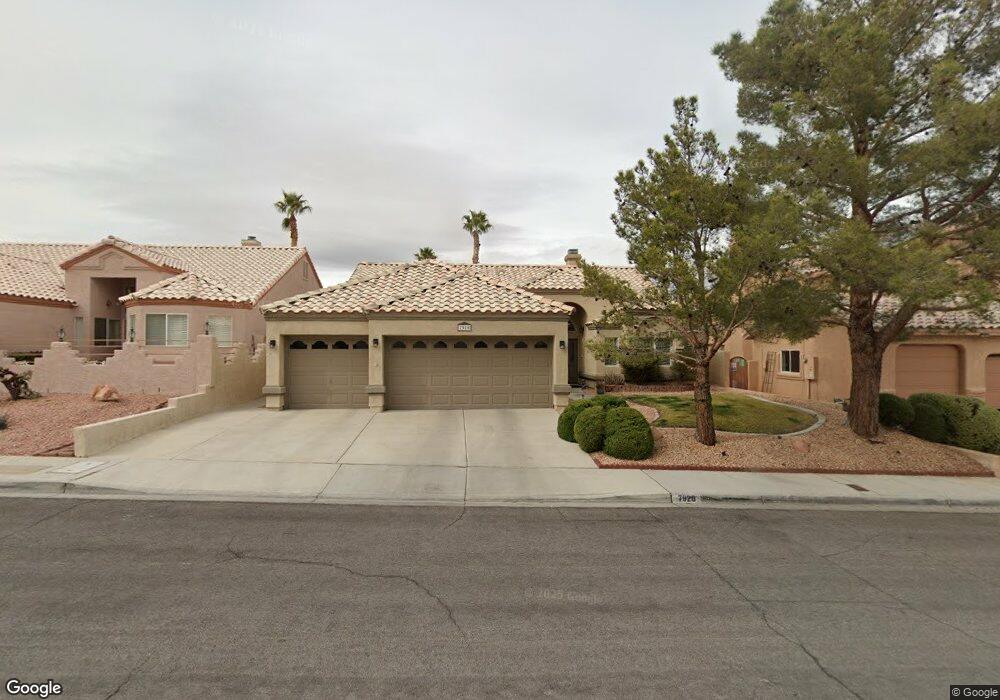
7920 Lakepoint Cir Las Vegas, NV 89128
Desert Shores NeighborhoodEstimated Value: $622,000 - $729,000
4
Beds
2
Baths
2,276
Sq Ft
$292/Sq Ft
Est. Value
About This Home
This home is located at 7920 Lakepoint Cir, Las Vegas, NV 89128 and is currently estimated at $665,219, approximately $292 per square foot. 7920 Lakepoint Cir is a home located in Clark County with nearby schools including Dorothy Eisenberg Elementary School, Marc Kahre Elementary School, and Ernest Becker Middle School.
Ownership History
Date
Name
Owned For
Owner Type
Purchase Details
Closed on
Jul 8, 2005
Sold by
Wahlig Mona T
Bought by
Wahlig Mona T and Mona T Wahlig 2004 Declaration Of Trust
Current Estimated Value
Purchase Details
Closed on
Aug 1, 2002
Sold by
Cozzolino Vincent J and Cozzolino Sandra M
Bought by
Wahlig Leonard O and Wahlig Mona T
Home Financials for this Owner
Home Financials are based on the most recent Mortgage that was taken out on this home.
Original Mortgage
$115,000
Interest Rate
6.52%
Purchase Details
Closed on
Jul 12, 1996
Sold by
Hinkell John and Hinkell Kathleen A
Bought by
Cozzolino Vincent J and Cozzolino Sandra M
Home Financials for this Owner
Home Financials are based on the most recent Mortgage that was taken out on this home.
Original Mortgage
$193,500
Interest Rate
8.39%
Purchase Details
Closed on
Mar 22, 1995
Sold by
Hinkell John
Bought by
Hinkell Kathleen
Home Financials for this Owner
Home Financials are based on the most recent Mortgage that was taken out on this home.
Original Mortgage
$40,000
Interest Rate
8.9%
Purchase Details
Closed on
Apr 7, 1994
Sold by
Hinkell John and Hinkell Kathleen
Bought by
Hinkell Kathleen
Create a Home Valuation Report for This Property
The Home Valuation Report is an in-depth analysis detailing your home's value as well as a comparison with similar homes in the area
Home Values in the Area
Average Home Value in this Area
Purchase History
| Date | Buyer | Sale Price | Title Company |
|---|---|---|---|
| Wahlig Mona T | -- | -- | |
| Wahlig Leonard O | $267,500 | Land Title | |
| Cozzolino Vincent J | $215,000 | United Title | |
| Hinkell Kathleen | -- | Nevada Title Company | |
| Hinkell Kathleen | -- | -- |
Source: Public Records
Mortgage History
| Date | Status | Borrower | Loan Amount |
|---|---|---|---|
| Closed | Wahlig Leonard O | $115,000 | |
| Previous Owner | Cozzolino Vincent J | $193,500 | |
| Previous Owner | Hinkell Kathleen | $40,000 |
Source: Public Records
Tax History Compared to Growth
Tax History
| Year | Tax Paid | Tax Assessment Tax Assessment Total Assessment is a certain percentage of the fair market value that is determined by local assessors to be the total taxable value of land and additions on the property. | Land | Improvement |
|---|---|---|---|---|
| 2025 | $3,846 | $148,462 | $58,800 | $89,662 |
| 2024 | $3,734 | $148,462 | $58,800 | $89,662 |
| 2023 | $3,734 | $137,920 | $52,500 | $85,420 |
| 2022 | $3,625 | $115,683 | $36,750 | $78,933 |
| 2021 | $3,520 | $113,471 | $38,150 | $75,321 |
| 2020 | $3,414 | $117,052 | $42,000 | $75,052 |
| 2019 | $3,373 | $109,155 | $35,000 | $74,155 |
| 2018 | $3,218 | $102,053 | $30,100 | $71,953 |
| 2017 | $3,359 | $102,350 | $29,050 | $73,300 |
| 2016 | $3,012 | $100,107 | $26,250 | $73,857 |
| 2015 | $3,006 | $92,578 | $19,950 | $72,628 |
| 2014 | $2,913 | $86,108 | $15,400 | $70,708 |
Source: Public Records
Map
Nearby Homes
- 8013 Harbor Oaks Cir
- 7908 Bridge Gate Dr
- 8024 Shorecrest Dr
- 8113 Sunset Cove Dr
- 2705 Crystal Beach Dr
- 2908 Channel Bay Dr
- 2653 Starfish Ct
- 2628 Seahorse Ct
- 2661 Golden Sands Dr
- 8113 Sapphire Bay Cir
- 8112 Sapphire Bay Cir
- 2637 Golden Sands Dr
- 8101 Bay Harbor Dr
- 7621 Hackensack Ct
- 7837 Sea Rock Rd
- 2596 Sun Reef Rd
- 7613 Hackensack Ct
- 7824 Riviera Beach Dr
- 8137 Desert Jewel Cir
- 2588 Sun Reef Rd
- 7924 Lakepoint Cir
- 7916 Lakepoint Cir
- 8009 Harbor Oaks Cir
- 8005 Harbor Oaks Cir
- 7928 Lakepoint Cir
- 8001 Harbor Oaks Cir
- 7921 Lakepoint Cir
- 7917 Lakepoint Cir
- 7925 Lakepoint Cir
- 8017 Harbor Oaks Cir
- 2800 Lakecrest Dr
- 7932 Lakepoint Cir
- 2740 Lakecrest Dr
- 7929 Lakepoint Cir
- 2804 Lakecrest Dr
- 2808 Lakecrest Dr
- 2808 Lakecrest Dr Unit n/a
- 7912 Rockbridge Cir
- 2736 Lakecrest Dr
- 8004 Harbor Oaks Cir