Estimated Value: $566,000 - $633,000
5
Beds
3
Baths
2,226
Sq Ft
$266/Sq Ft
Est. Value
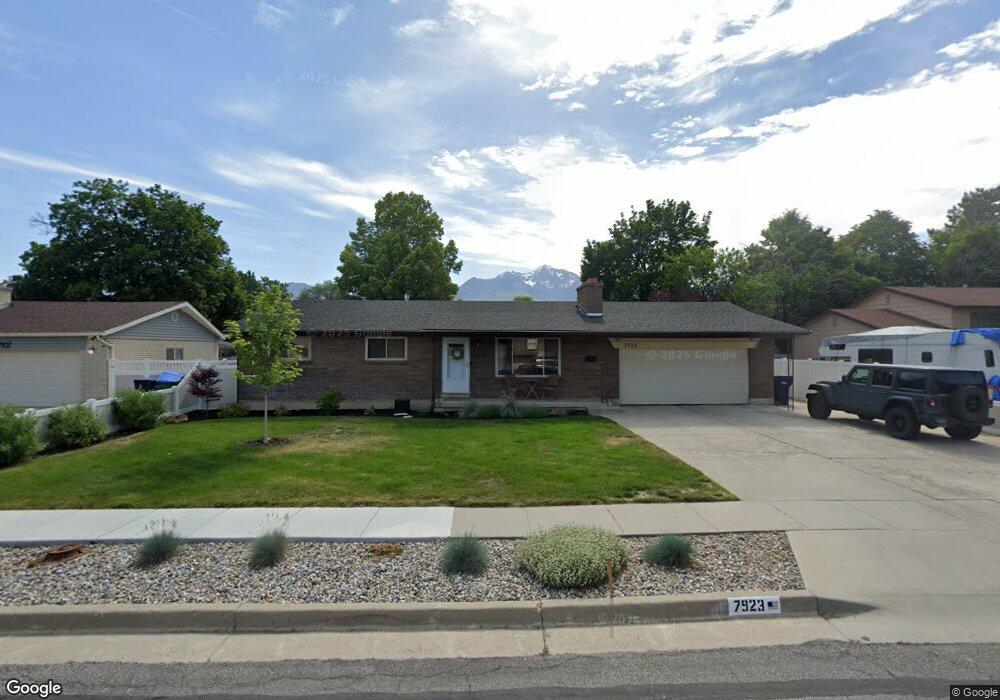
About This Home
This home is located at 7923 S Ponderosa Cir, Sandy, UT 84094 and is currently estimated at $591,662, approximately $265 per square foot. 7923 S Ponderosa Cir is a home located in Salt Lake County with nearby schools including East Sandy School, Union Middle School, and Hillcrest High School.
Ownership History
Date
Name
Owned For
Owner Type
Purchase Details
Closed on
Jun 23, 2021
Sold by
Glen Hawkins Cecil
Bought by
Cecil Glen Hawkins Sr Family Living Trust
Current Estimated Value
Home Financials for this Owner
Home Financials are based on the most recent Mortgage that was taken out on this home.
Original Mortgage
$396,400
Outstanding Balance
$358,891
Interest Rate
2.9%
Mortgage Type
New Conventional
Estimated Equity
$232,771
Purchase Details
Closed on
Jun 16, 2021
Sold by
Hawkins Cecil Glen and Hawkins David Evert
Bought by
Watkins Olivia Rachel and Baker Austin Bradley
Home Financials for this Owner
Home Financials are based on the most recent Mortgage that was taken out on this home.
Original Mortgage
$396,400
Outstanding Balance
$358,891
Interest Rate
2.9%
Mortgage Type
New Conventional
Estimated Equity
$232,771
Purchase Details
Closed on
Dec 2, 2014
Sold by
Tingey Lanel
Bought by
Tingey Lanel
Purchase Details
Closed on
Sep 18, 2008
Sold by
Hawkins Cecil G
Bought by
Hawkins Cecil Glen
Create a Home Valuation Report for This Property
The Home Valuation Report is an in-depth analysis detailing your home's value as well as a comparison with similar homes in the area
Home Values in the Area
Average Home Value in this Area
Purchase History
| Date | Buyer | Sale Price | Title Company |
|---|---|---|---|
| Cecil Glen Hawkins Sr Family Living Trust | -- | -- | |
| Watkins Olivia Rachel | -- | First American Title | |
| Tingey Lanel | -- | None Available | |
| Hawkins Cecil Glen | -- | None Available |
Source: Public Records
Mortgage History
| Date | Status | Borrower | Loan Amount |
|---|---|---|---|
| Open | Watkins Olivia Rachel | $396,400 |
Source: Public Records
Tax History Compared to Growth
Tax History
| Year | Tax Paid | Tax Assessment Tax Assessment Total Assessment is a certain percentage of the fair market value that is determined by local assessors to be the total taxable value of land and additions on the property. | Land | Improvement |
|---|---|---|---|---|
| 2025 | $2,943 | $540,400 | $164,100 | $376,300 |
| 2024 | $2,943 | $543,600 | $157,800 | $385,800 |
| 2023 | $2,910 | $536,100 | $149,900 | $386,200 |
| 2022 | $2,972 | $535,300 | $147,000 | $388,300 |
| 2021 | $813 | $352,200 | $114,300 | $237,900 |
| 2020 | $2,234 | $322,600 | $114,300 | $208,300 |
| 2019 | $2,154 | $303,000 | $107,800 | $195,200 |
| 2018 | $2,000 | $293,300 | $107,800 | $185,500 |
| 2017 | $1,837 | $257,200 | $107,800 | $149,400 |
| 2016 | $1,785 | $241,600 | $107,800 | $133,800 |
| 2015 | $1,857 | $233,000 | $129,800 | $103,200 |
| 2014 | $1,710 | $210,700 | $118,800 | $91,900 |
Source: Public Records
Map
Nearby Homes
- 1316 Pinewood Dr
- 7964 S 860 E
- 7825 S Spruce Tree Ln
- 760 E 8080 S
- 909 E 7865 S
- 7926 S 965 E
- 7692 Chad St
- 8087 S 615 E
- 954 E 7725 S
- 752 E Chad Cir
- 8268 S 865 E
- 7709 S Sunbird Way
- 842 E 8270 S
- 772 E 8270 S
- 7723 S Briarsprings Dr
- 8143 S 535 E
- 8284 S 745 E
- 7720 S 700 E
- 787 Casa Blanca Cir
- 651 E Williamsburg Park Cir
- 7923 Ponderosa Cir
- 7907 S Ponderosa Cir
- 7907 Ponderosa Cir
- 7943 Ponderosa Cir
- 7924 Ponderosa Way
- 7908 S Ponderosa Way
- 7908 Ponderosa Way
- 7940 Ponderosa Way
- 7924 Ponderosa Cir
- 7953 Ponderosa Cir
- 7953 S Ponderosa Cir
- 7895 Ponderosa Cir
- 7908 Ponderosa Cir
- 7942 Ponderosa Cir
- 820 Pinewood Dr
- 7952 Ponderosa Cir
- 7894 Ponderosa Cir
- 7894 S Ponderosa Cir
- 817 Cedar Terrace Dr
- 7956 Ponderosa Way