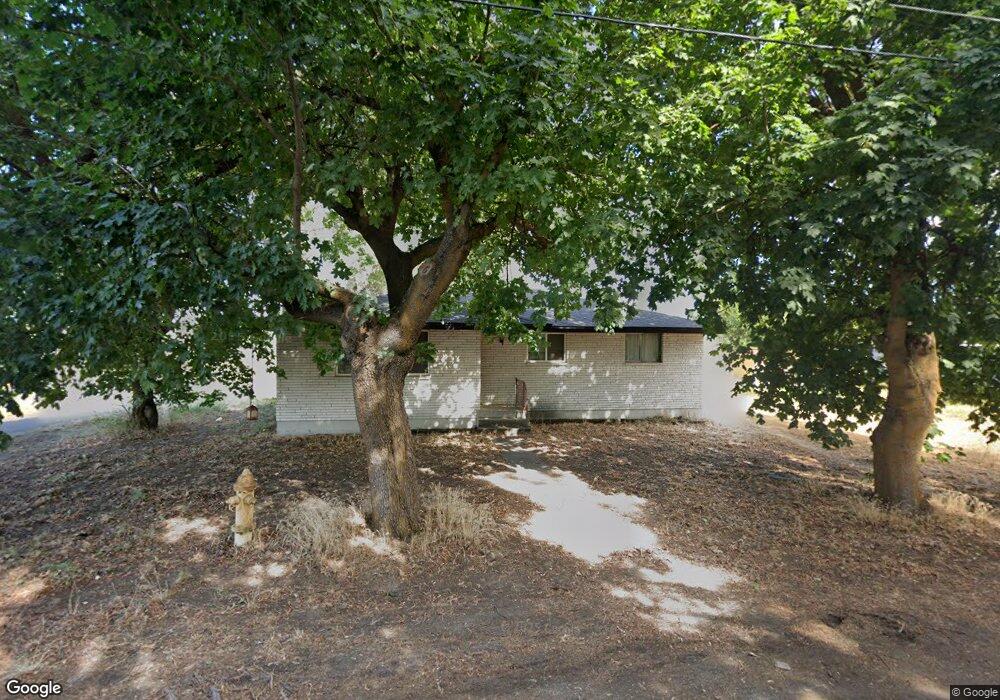
7924 N Altamont St Spokane, WA 99217
Hillyard NeighborhoodEstimated Value: $348,000 - $390,000
3
Beds
2
Baths
1,188
Sq Ft
$305/Sq Ft
Est. Value
About This Home
This home is located at 7924 N Altamont St, Spokane, WA 99217 and is currently estimated at $362,056, approximately $304 per square foot. 7924 N Altamont St is a home located in Spokane County with nearby schools including Arlington Elementary School, Garry Middle School, and Rogers High School.
Ownership History
Date
Name
Owned For
Owner Type
Purchase Details
Closed on
Nov 27, 2006
Sold by
Torosian Karen L
Bought by
Torosian Garabed and Torosian Karen L
Current Estimated Value
Purchase Details
Closed on
Oct 25, 2004
Sold by
Estate Of Juanita J Lemon
Bought by
Torosian Karen L
Home Financials for this Owner
Home Financials are based on the most recent Mortgage that was taken out on this home.
Original Mortgage
$145,000
Outstanding Balance
$72,167
Interest Rate
5.74%
Mortgage Type
Purchase Money Mortgage
Estimated Equity
$289,889
Purchase Details
Closed on
Oct 22, 2004
Sold by
Torosian Garabed
Bought by
Torosian Karen L
Home Financials for this Owner
Home Financials are based on the most recent Mortgage that was taken out on this home.
Original Mortgage
$145,000
Outstanding Balance
$72,167
Interest Rate
5.74%
Mortgage Type
Purchase Money Mortgage
Estimated Equity
$289,889
Purchase Details
Closed on
Aug 6, 2003
Sold by
Steeneck Daryn J and Steeneck Daryn
Bought by
Estate Of Juanita J Lemon
Purchase Details
Closed on
Mar 6, 2002
Sold by
Lemon Juanita J
Bought by
Steeneek Daryn J
Create a Home Valuation Report for This Property
The Home Valuation Report is an in-depth analysis detailing your home's value as well as a comparison with similar homes in the area
Home Values in the Area
Average Home Value in this Area
Purchase History
| Date | Buyer | Sale Price | Title Company |
|---|---|---|---|
| Torosian Garabed | -- | Pacific Nw Title | |
| Torosian Karen L | $145,000 | Transnation Title | |
| Torosian Karen L | -- | Transnation Title | |
| Estate Of Juanita J Lemon | -- | -- | |
| Steeneek Daryn J | $101,185 | -- |
Source: Public Records
Mortgage History
| Date | Status | Borrower | Loan Amount |
|---|---|---|---|
| Open | Torosian Karen L | $145,000 |
Source: Public Records
Tax History Compared to Growth
Tax History
| Year | Tax Paid | Tax Assessment Tax Assessment Total Assessment is a certain percentage of the fair market value that is determined by local assessors to be the total taxable value of land and additions on the property. | Land | Improvement |
|---|---|---|---|---|
| 2025 | $3,135 | $321,700 | $110,000 | $211,700 |
| 2024 | $3,135 | $295,400 | $110,000 | $185,400 |
| 2023 | $2,579 | $289,500 | $80,000 | $209,500 |
| 2022 | $2,740 | $248,600 | $60,000 | $188,600 |
| 2021 | $2,500 | $193,000 | $60,000 | $133,000 |
| 2020 | $2,243 | $167,500 | $54,000 | $113,500 |
| 2019 | $2,045 | $155,600 | $50,000 | $105,600 |
| 2018 | $2,354 | $154,500 | $50,000 | $104,500 |
| 2017 | $2,144 | $142,300 | $45,000 | $97,300 |
| 2016 | $2,178 | $142,800 | $45,000 | $97,800 |
| 2015 | $2,145 | $137,000 | $45,000 | $92,000 |
| 2014 | -- | $136,000 | $45,000 | $91,000 |
| 2013 | -- | $0 | $0 | $0 |
Source: Public Records
Map
Nearby Homes
- 7505 N Altamont St
- 7405 N Smith St
- 7422 N Magnolia St
- 7303 N Crestline St Unit 18
- 7303 N Crestline St Unit 35
- 2920 E Lincoln Rd
- 3022 E Lincoln Rd
- 7203 N Smith St
- 7112 N Crestline St
- 6811 N Altamont St
- 1609 E Clover Ave
- 1328 E Sharpsburg Ave
- 6902 N Capri Ln
- 6408 N Altamont St
- 1209 E Lyons Ave Unit 221
- 6811 N Capri Ln
- 7934 N Wilding Dr
- 7878 N Wilding Dr Unit 64
- 7878 N Wilding Dr Unit 4
- 7878 N Wilding Dr Unit 46
- 7906 N Altamont St
- 7917 N Altamont St
- 7901 N Altamont St
- 7923 N Altamont St
- 7820 N Altamont St
- 7819 N Altamont St
- 2221 E Lincoln Rd
- 7919 N Altamont St
- 2321 E Lincoln Rd
- 7811 N Altamont St
- 7805 N Altamont St
- 7806 N Altamont St
- 2124 E Lincoln Rd Unit 152
- 2505 E Lincoln Rd
- 7917 N Smith St
- 7719 N Altamont St
- 7722 N Altamont St
- 2122 E Lincoln Rd
- 7825 N Smith St
- 7717 N Altamont St