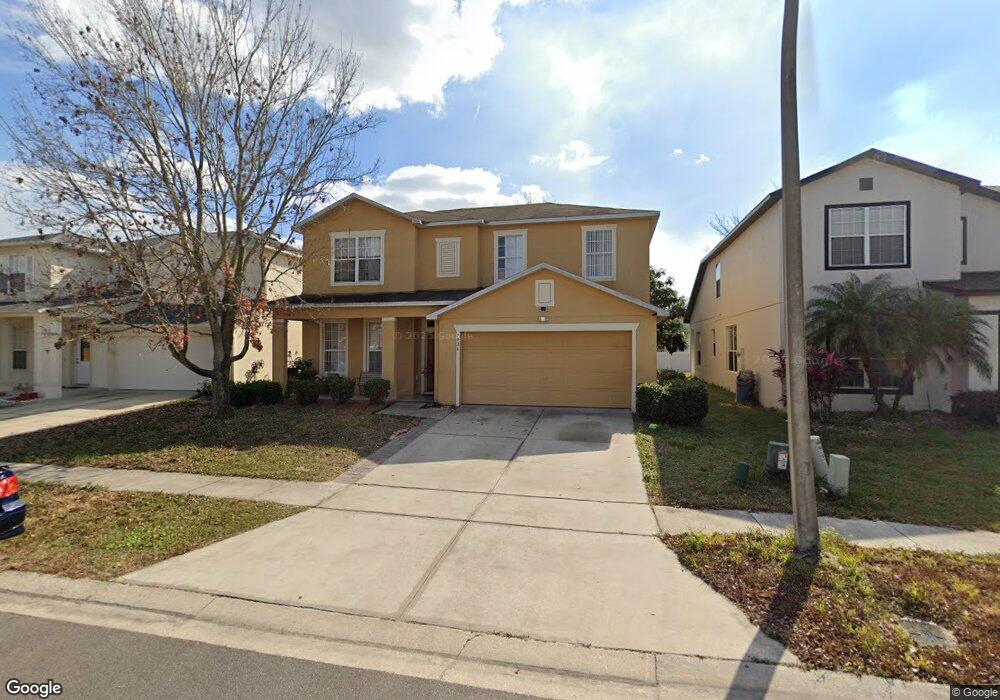
7926 Bear Claw Run Orlando, FL 32825
Chickasaw NeighborhoodEstimated Value: $419,000 - $466,000
3
Beds
3
Baths
2,955
Sq Ft
$149/Sq Ft
Est. Value
About This Home
This home is located at 7926 Bear Claw Run, Orlando, FL 32825 and is currently estimated at $440,514, approximately $149 per square foot. 7926 Bear Claw Run is a home located in Orange County with nearby schools including Forsyth Woods Elementary School, Union Park Middle School, and Colonial High School.
Ownership History
Date
Name
Owned For
Owner Type
Purchase Details
Closed on
Nov 18, 2024
Sold by
Yim Chau Lo
Bought by
Lee Johnny Kit
Current Estimated Value
Purchase Details
Closed on
Dec 27, 2012
Sold by
Lam Sau Cheuk
Bought by
Lo Yimm Chau
Purchase Details
Closed on
Oct 18, 2007
Sold by
Li Kit and Cheng Chun F
Bought by
Lam Sau Cheuk
Home Financials for this Owner
Home Financials are based on the most recent Mortgage that was taken out on this home.
Original Mortgage
$24,120
Interest Rate
6.26%
Mortgage Type
Credit Line Revolving
Purchase Details
Closed on
Apr 13, 2006
Sold by
Weekley Homes Lp
Bought by
Li Kit and Cheng Chun F
Home Financials for this Owner
Home Financials are based on the most recent Mortgage that was taken out on this home.
Original Mortgage
$32,640
Interest Rate
5.94%
Mortgage Type
Stand Alone Second
Create a Home Valuation Report for This Property
The Home Valuation Report is an in-depth analysis detailing your home's value as well as a comparison with similar homes in the area
Home Values in the Area
Average Home Value in this Area
Purchase History
| Date | Buyer | Sale Price | Title Company |
|---|---|---|---|
| Lee Johnny Kit | $100 | None Listed On Document | |
| Lo Yimm Chau | $130,000 | Saint Lawrence Title | |
| Lam Sau Cheuk | $268,000 | Dba Greenway Title | |
| Li Kit | $326,400 | Ticor Title Insurance |
Source: Public Records
Mortgage History
| Date | Status | Borrower | Loan Amount |
|---|---|---|---|
| Previous Owner | Lam Sau Cheuk | $24,120 | |
| Previous Owner | Li Kit | $32,640 | |
| Previous Owner | Li Kit | $261,051 |
Source: Public Records
Tax History Compared to Growth
Tax History
| Year | Tax Paid | Tax Assessment Tax Assessment Total Assessment is a certain percentage of the fair market value that is determined by local assessors to be the total taxable value of land and additions on the property. | Land | Improvement |
|---|---|---|---|---|
| 2025 | $6,358 | $364,812 | -- | -- |
| 2024 | $5,677 | $364,812 | -- | -- |
| 2023 | $5,677 | $392,506 | $45,000 | $347,506 |
| 2022 | $5,059 | $337,028 | $45,000 | $292,028 |
| 2021 | $4,329 | $249,171 | $38,000 | $211,171 |
| 2020 | $4,197 | $250,802 | $38,000 | $212,802 |
| 2019 | $4,450 | $252,433 | $38,000 | $214,433 |
| 2018 | $2,009 | $139,931 | $0 | $0 |
| 2017 | $1,965 | $203,209 | $22,000 | $181,209 |
| 2016 | $1,936 | $183,978 | $25,000 | $158,978 |
| 2015 | $1,965 | $173,939 | $25,000 | $148,939 |
| 2014 | $2,006 | $166,166 | $25,000 | $141,166 |
Source: Public Records
Map
Nearby Homes
- 7908 Bear Claw Run
- 7551 Bear Claw Run
- 7906 Napoleon St
- 7925 Napoleon St
- 8258 Golden Chickasaw Cir
- 952 Courtyard Ln Unit 32
- 952 Courtyard Ln Unit 41
- 8215 Sun Spring Cir Unit 53
- 1103 N Chickasaw Trail
- 7800 Richwood Dr
- 1211 Kilbee Cir Unit 4004
- 8529 Arrow Head Cir Unit 4963
- 766 Ashley Ln
- 8503 Plumeria Ave
- 7338 Azalea Cove Cir
- 1543 Indian Summer Ln Unit 4920
- 7557 Azalea Cove Cir
- 8514 Rainbow Ave
- 7358 Azalea Cove Cir
- 682 Ascot Cir
- 7920 Bear Claw Run
- 7932 Bear Claw Run
- 7938 Bear Claw Run
- 7914 Bear Claw Run
- 7927 Bear Claw Run
- 7944 Bear Claw Run
- 7933 Bear Claw Run
- 7921 Bear Claw Run
- 7932 Niagara Falls Ct
- 7926 Niagara Falls Ct
- 7938 Niagara Falls Ct
- 7920 Niagara Falls Ct
- 7915 Bear Claw Run
- 7939 Bear Claw Run
- 7944 Niagara Falls Ct
- 7860 Bear Claw Run
- 7950 Bear Claw Run
- 7945 Bear Claw Run
- 7914 Niagara Falls Ct
- 7909 Bear Claw Run