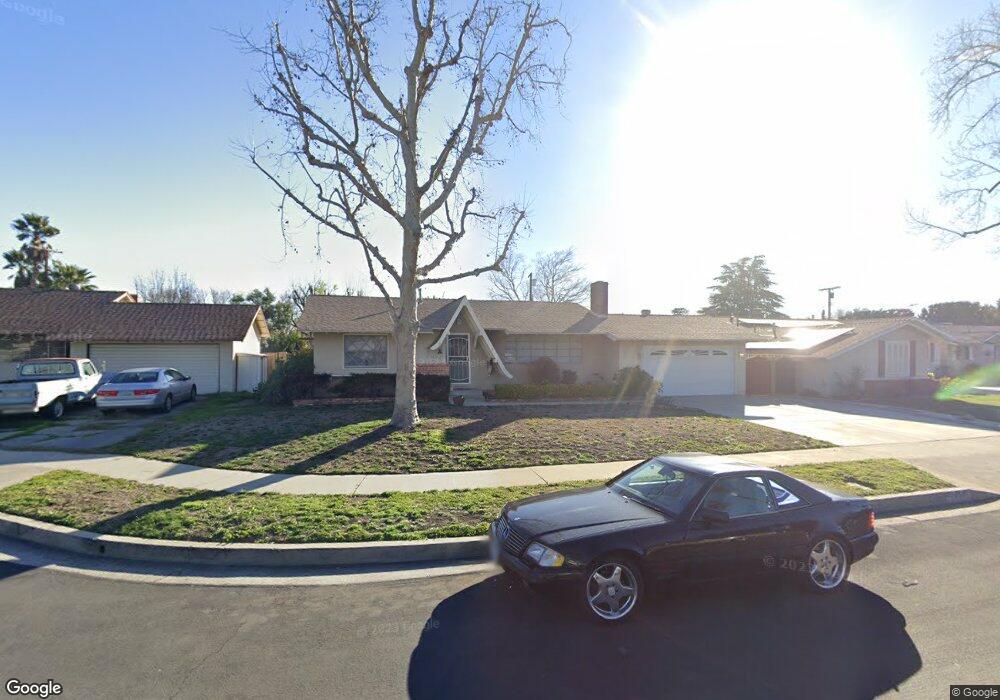
7928 Moorcroft Ave Canoga Park, CA 91304
Canoga Park NeighborhoodEstimated Value: $837,000 - $950,000
3
Beds
2
Baths
1,587
Sq Ft
$570/Sq Ft
Est. Value
About This Home
This home is located at 7928 Moorcroft Ave, Canoga Park, CA 91304 and is currently estimated at $904,127, approximately $569 per square foot. 7928 Moorcroft Ave is a home located in Los Angeles County with nearby schools including Capistrano Avenue Elementary School, Christopher Columbus Middle School, and Canoga Park Senior High School.
Ownership History
Date
Name
Owned For
Owner Type
Purchase Details
Closed on
Feb 4, 2009
Sold by
Deluca Paul and Deluca Mary Catherine
Bought by
Deluca Paul Joseph and Deluca Mary Catherine
Current Estimated Value
Purchase Details
Closed on
Jan 23, 2002
Sold by
Deluca Paul and Deluca Mary Catherine
Bought by
Deluca Paul and Deluca Catherine
Home Financials for this Owner
Home Financials are based on the most recent Mortgage that was taken out on this home.
Original Mortgage
$195,000
Outstanding Balance
$80,422
Interest Rate
7.17%
Estimated Equity
$823,705
Purchase Details
Closed on
Sep 23, 1997
Sold by
Barton Sharon
Bought by
Deluca Paul and Deluca Mary Catherine
Home Financials for this Owner
Home Financials are based on the most recent Mortgage that was taken out on this home.
Original Mortgage
$145,600
Interest Rate
7.49%
Create a Home Valuation Report for This Property
The Home Valuation Report is an in-depth analysis detailing your home's value as well as a comparison with similar homes in the area
Home Values in the Area
Average Home Value in this Area
Purchase History
| Date | Buyer | Sale Price | Title Company |
|---|---|---|---|
| Deluca Paul Joseph | -- | None Available | |
| Deluca Paul | -- | Southland Title | |
| Deluca Paul | $182,000 | -- |
Source: Public Records
Mortgage History
| Date | Status | Borrower | Loan Amount |
|---|---|---|---|
| Open | Deluca Paul | $195,000 | |
| Closed | Deluca Paul | $145,600 |
Source: Public Records
Tax History Compared to Growth
Tax History
| Year | Tax Paid | Tax Assessment Tax Assessment Total Assessment is a certain percentage of the fair market value that is determined by local assessors to be the total taxable value of land and additions on the property. | Land | Improvement |
|---|---|---|---|---|
| 2025 | $3,764 | $290,577 | $140,655 | $149,922 |
| 2024 | $3,764 | $284,881 | $137,898 | $146,983 |
| 2023 | $3,696 | $279,296 | $135,195 | $144,101 |
| 2022 | $3,534 | $273,821 | $132,545 | $141,276 |
| 2021 | $3,485 | $268,453 | $129,947 | $138,506 |
| 2019 | $3,386 | $260,493 | $126,094 | $134,399 |
| 2018 | $3,255 | $255,386 | $123,622 | $131,764 |
| 2016 | $3,099 | $245,472 | $118,823 | $126,649 |
| 2015 | $3,056 | $241,786 | $117,039 | $124,747 |
| 2014 | $3,074 | $237,051 | $114,747 | $122,304 |
Source: Public Records
Map
Nearby Homes
- 7845 Nevada Ave
- 22158 Elkwood St
- 22151 Ingomar St
- 22345 Cantara St
- 22128 Burton St
- 7816 Shoup Ave
- 7957 Sausalito Ave
- 7749 Nita Ave
- 7845 Sausalito Ave
- 7831 Capistrano Ave
- 7826 Topanga Canyon Blvd Unit 218
- 7826 Topanga Canyon Blvd Unit 301
- 7826 Topanga Canyon Blvd Unit 231
- 7826 Topanga Unit 213
- 7719 Shoup Ave
- 7934 Vassar Ave
- 7800 Topanga Canyon Blvd Unit 208
- 22115 Hackney St
- 7650 Topanga Canyon Blvd Unit 14
- 22020 Saticoy St
- 7922 Moorcroft Ave
- 7936 Moorcroft Ave
- 7914 Moorcroft Ave
- 7944 Moorcroft Ave
- 7933 Farralone Ave
- 7925 Farralone Ave
- 7939 Farralone Ave
- 7929 Moorcroft Ave
- 7917 Farralone Ave
- 7946 Moorcroft Ave
- 7923 Moorcroft Ave
- 7908 Moorcroft Ave
- 7937 Moorcroft Ave
- 7917 Farralone Ave
- 7947 Farralone Ave
- 7915 Moorcroft Ave
- 7909 Farralone Ave
- 7943 Moorcroft Ave
- 7915 Farralone Ave
- 22222 Strathern St