Estimated Value: $587,000 - $664,000
4
Beds
3
Baths
1,980
Sq Ft
$316/Sq Ft
Est. Value
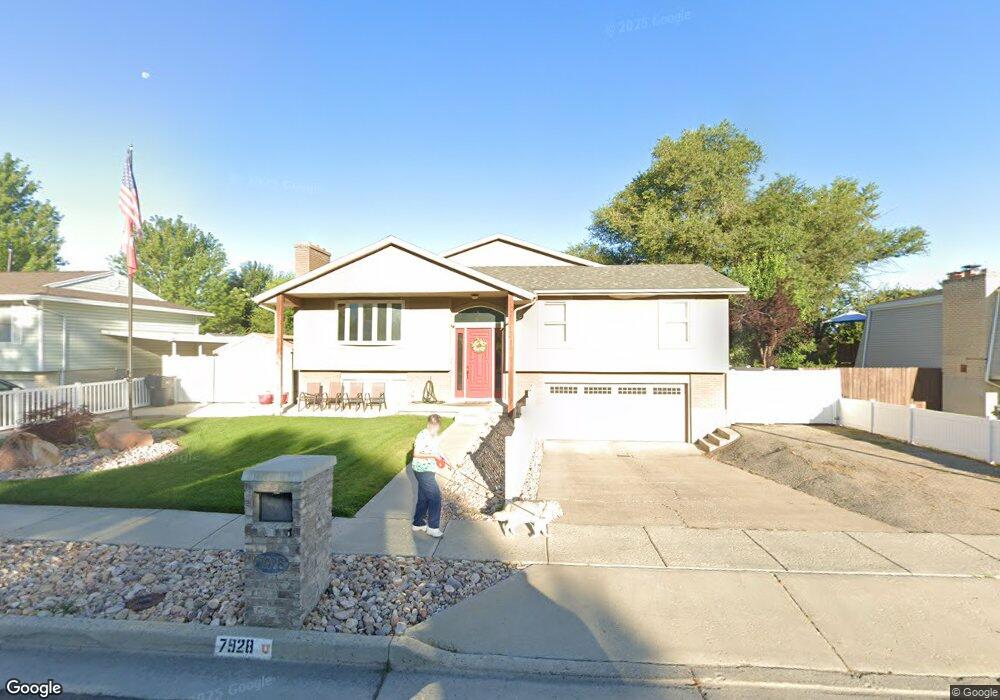
About This Home
This home is located at 7928 S 860 E, Sandy, UT 84094 and is currently estimated at $624,901, approximately $315 per square foot. 7928 S 860 E is a home located in Salt Lake County with nearby schools including East Sandy School, Union Middle School, and Hillcrest High School.
Ownership History
Date
Name
Owned For
Owner Type
Purchase Details
Closed on
Jan 21, 2009
Sold by
Dority Michael Kent and Dority Terrie L
Bought by
Dority Michael and Dority Terrie
Current Estimated Value
Home Financials for this Owner
Home Financials are based on the most recent Mortgage that was taken out on this home.
Original Mortgage
$328,652
Outstanding Balance
$211,150
Interest Rate
5.49%
Mortgage Type
FHA
Estimated Equity
$413,751
Purchase Details
Closed on
Mar 11, 2003
Sold by
Dority Michael Kent
Bought by
Dority Michael Kent and Dority Terrie L
Home Financials for this Owner
Home Financials are based on the most recent Mortgage that was taken out on this home.
Original Mortgage
$26,250
Interest Rate
5.83%
Mortgage Type
Credit Line Revolving
Create a Home Valuation Report for This Property
The Home Valuation Report is an in-depth analysis detailing your home's value as well as a comparison with similar homes in the area
Home Values in the Area
Average Home Value in this Area
Purchase History
| Date | Buyer | Sale Price | Title Company |
|---|---|---|---|
| Dority Michael | -- | Monument Title Ins Co | |
| Dority Michael Kent | -- | Eagle Point Title | |
| Dority Michale Kent | -- | Eagle Point Title |
Source: Public Records
Mortgage History
| Date | Status | Borrower | Loan Amount |
|---|---|---|---|
| Open | Dority Michael | $328,652 | |
| Closed | Dority Michale Kent | $26,250 |
Source: Public Records
Tax History
| Year | Tax Paid | Tax Assessment Tax Assessment Total Assessment is a certain percentage of the fair market value that is determined by local assessors to be the total taxable value of land and additions on the property. | Land | Improvement |
|---|---|---|---|---|
| 2025 | $3,473 | $642,400 | $163,200 | $479,200 |
| 2024 | $3,473 | $641,600 | $157,000 | $484,600 |
| 2023 | $3,422 | $630,300 | $149,200 | $481,100 |
| 2022 | $3,209 | $578,100 | $146,300 | $431,800 |
| 2021 | $2,683 | $410,600 | $113,700 | $296,900 |
| 2020 | $2,579 | $372,400 | $113,700 | $258,700 |
| 2019 | $2,512 | $353,300 | $107,300 | $246,000 |
| 2016 | $2,302 | $311,500 | $107,300 | $204,200 |
Source: Public Records
Map
Nearby Homes
- 882 E 7905 S
- 8023 S Pinewood Dr
- 917 E 7865 S
- 798 E Spruce Tree Ln
- 7819 S Spruce Tree Ln
- 760 E 8080 S
- 7809 Norfolk Pine Way
- 7795 S 1000 E
- 8268 S 865 E
- 8087 S 615 E
- 7628 Casa Verde St E
- 8223 S 1000 E
- 7975 S Showcase Ln
- 7738 S Sunbird Way
- 791 Casa Blanca Cir
- 687 E Orchard Vista Ct
- 7755 S 1130 E
- 8260 S 560 E
- 1089 E 8320 S Unit 22
- 1206 E Moss Cir
- 7916 S 860 E
- 7940 S 860 E
- 7911 S Ponderosa Way
- 7911 Ponderosa Way
- 7897 Ponderosa Way
- 7925 S Ponderosa Way
- 7925 Ponderosa Way
- 865 E 7945 S
- 866 E 7905 S
- 7904 S 860 E
- 7952 S 860 E
- 7885 Ponderosa Way
- 7941 Ponderosa Way
- 873 E 7945 S
- 864 E 7945 S
- 874 E 7905 S
- 7892 S 860 E
- 7871 Ponderosa Way
- 867 E 7905 S
- 7957 Ponderosa Way
Your Personal Tour Guide
Ask me questions while you tour the home.