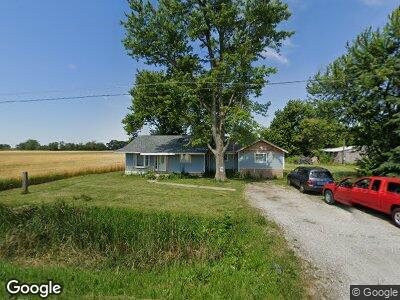
7929 Rudolph Rd Rudolph, OH 43462
Estimated Value: $111,000 - $168,000
1
Bed
1
Bath
1,308
Sq Ft
$109/Sq Ft
Est. Value
About This Home
This home is located at 7929 Rudolph Rd, Rudolph, OH 43462 and is currently estimated at $142,000, approximately $108 per square foot. 7929 Rudolph Rd is a home located in Wood County with nearby schools including Bowling Green High School.
Ownership History
Date
Name
Owned For
Owner Type
Purchase Details
Closed on
Apr 14, 2023
Sold by
Chapa Connie J
Bought by
Chapa Mcpeake Rachel
Current Estimated Value
Purchase Details
Closed on
Sep 15, 2020
Sold by
Chapa Connie J
Bought by
Chapa Connie J and Chapa John Fv
Purchase Details
Closed on
Aug 30, 2006
Sold by
Fannie Mae
Bought by
Chapa Connie J
Home Financials for this Owner
Home Financials are based on the most recent Mortgage that was taken out on this home.
Original Mortgage
$71,000
Interest Rate
6.77%
Mortgage Type
Purchase Money Mortgage
Purchase Details
Closed on
Apr 6, 2006
Sold by
Federal National Mortgage Association
Bought by
Reynolds Renee R
Purchase Details
Closed on
Feb 15, 2006
Sold by
Reynolds Renee E and Mortgage Electronic Registrati
Bought by
Fanniemae and Federal National Mortgage Association
Purchase Details
Closed on
Nov 28, 1994
Sold by
Stockwell Dennis
Bought by
Beckford Rod and Beckford Tonia
Purchase Details
Closed on
Sep 18, 1990
Bought by
Stockwell Dennis E
Create a Home Valuation Report for This Property
The Home Valuation Report is an in-depth analysis detailing your home's value as well as a comparison with similar homes in the area
Home Values in the Area
Average Home Value in this Area
Purchase History
| Date | Buyer | Sale Price | Title Company |
|---|---|---|---|
| Chapa Connie J | $71,000 | Louisville Title | |
| Fanniemae | $56,000 | None Available | |
| Beckford Rod | $26,000 | -- | |
| Stockwell Dennis E | -- | -- |
Source: Public Records
Mortgage History
| Date | Status | Borrower | Loan Amount |
|---|---|---|---|
| Open | Chapa Connie J | $38,700 | |
| Previous Owner | Chapa Connie J | $62,190 | |
| Previous Owner | Chapa Connie J | $71,000 | |
| Closed | Beckford Rod | $0 |
Source: Public Records
Tax History Compared to Growth
Tax History
| Year | Tax Paid | Tax Assessment Tax Assessment Total Assessment is a certain percentage of the fair market value that is determined by local assessors to be the total taxable value of land and additions on the property. | Land | Improvement |
|---|---|---|---|---|
| 2023 | $1,135 | $26,360 | $2,980 | $23,380 |
| 2022 | $938 | $21,280 | $2,590 | $18,690 |
| 2021 | $922 | $21,280 | $2,590 | $18,690 |
| 2020 | $930 | $21,280 | $2,590 | $18,690 |
| 2019 | $871 | $19,180 | $2,590 | $16,590 |
| 2018 | $868 | $19,180 | $2,590 | $16,590 |
| 2017 | $799 | $19,180 | $2,590 | $16,590 |
| 2016 | $712 | $15,860 | $2,590 | $13,270 |
| 2015 | $712 | $15,860 | $2,590 | $13,270 |
| 2014 | $750 | $15,860 | $2,590 | $13,270 |
| 2013 | $822 | $15,860 | $2,590 | $13,270 |
Source: Public Records
Map
Nearby Homes
- 13921 Defiance Pike
- 13863 Mermill Rd
- 10243 S Dixie Hwy
- 13451 Freyman Rd
- 404 N Tarr St
- 309 Margaret Ave
- 401 N 3rd St
- 930 E Broadway St Unit 135
- 222 E Broadway St
- 0 Eagleville Rd
- 201 W Broadway St
- 1000 Deer Ridge Run
- 994 Deer Ridge Run
- 12450 Potter Rd
- 900 E Water St
- 0 Sand Ridge Rd Unit Lot 5 6095897
- 0 Sand Ridge Rd Unit Lot 4 6095895
- 0 Sand Ridge Rd Unit Lot 1
- 318 S Main St
- 930 Pine Valley Dr
- 7929 Rudolph Rd Unit 400
- 7929 Rudolph Rd
- 7961 Rudolph Rd
- 7961 Rudolph Rd
- 14043 Bays Rd
- 7820 Rudolph Rd
- 7820 Rudolph Rd
- 8038 Rudolph Rd
- 8038 Rudolph Rd
- 14030 Bays Rd
- 14081 Bays Rd
- 14081 Bays Rd
- 14081 Bays Rd
- 14081 Bays Rd
- 14081 Bays Rd
- 14081 Bays Rd
- 14081 Bays Rd
- 14081 Bays Rd
- 14081 Bays Rd
- 14081 Bays Rd